
BTC/USD Weekly outlook : Bitcoin Price
- This week, the BTCUSD has shown some bullish trend.
- There is a small upward retracement from the general downward trend.
The long term bearish trend of the BTCUSD has found some resistance. From the beginning of this week, the pair has experienced some bullish price movement which still has great momentum to go on.
This is a relief to the traders who had placed buy orders between 18th and 21st March with an expectation that there was a change of trend. Many such traders are now praying that the price moves past 7842, which was the opening price on date 18th.
Over the last few months, bitcoin price has been on the decline even if it has tried to rise severally without any avail. This can be contributed to the decline in the value of Bitcoin tokens in general over the last three months. Bitcoin of all the cryptocurrencies have been the worst hit by the falling prices of digital currencies.
There are fears currently among bitcoin brokers that the price of Bitcoin may fall to below 7500.
Let us look at this week’s breakdown for both daily traders and weekly traders.
Daily chart

Using the Moving average, MACD and Stochastic Indicators on the daily chart, they all give a node for a buy order.
For the moving average, the prices are just about to cross the moving average. If the current candlestick closes above the moving average. The trader can open a buy order if the next candlestick opens as a bullish candlestick.
For the Stochastic Indicator, the blue line is already above the red line and both are heading upwards. This confirms the bullish trend.
The momentum indicator is on its way back above zero, but we shall have to wait for it to cross the zero level.
For short term traders, traders with sell orders should close immediately and wait for the bearish trend to resume or wait to place buy orders. But they will have to wait for the condition of the moving average to be confirmed.
Weekly chart
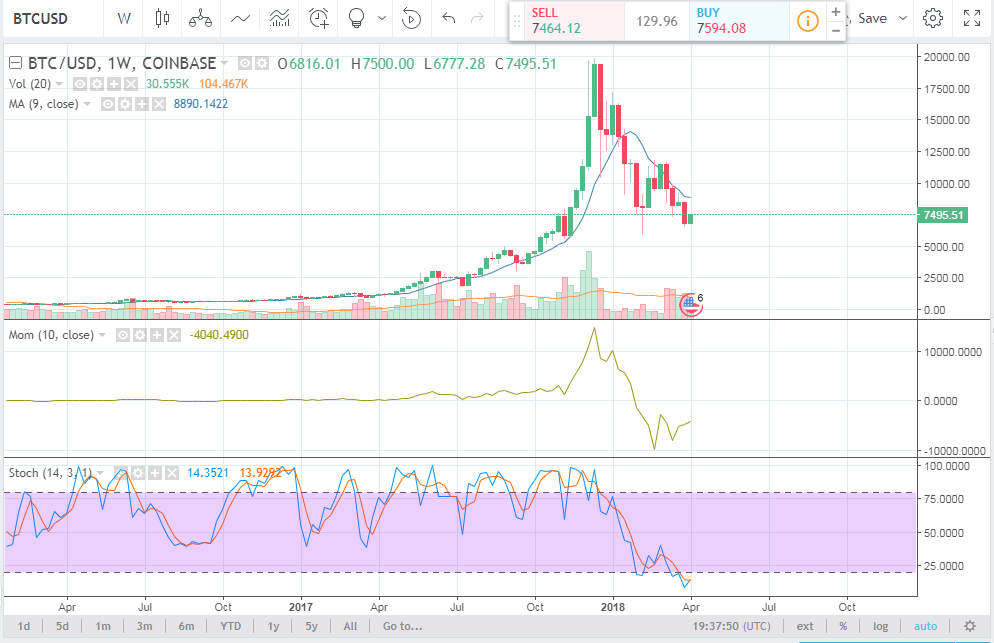
The weekly chart also confirms the change in trend of the Bitcoin price. For now, traders with long term sell orders should close. With the momentum that the prices have moved up, if a sell order is not closed at this point, the trader may end up making huge losses if this turns out to be a trend reversal.
For the weekly traders, the upward trend is not 100% confirmed and they should approach the market with caution. Patience is the only thing that shall help in this case.
After closing any sell orders, traders should be patient to confirm whether to open other sell orders or to place buy orders according the how the market will behave. When the market price crosses the moving average, then weekly traders should be free to place buy orders and have a guarantee of profits. And if the bearish trend chooses to continue, then the traders will just have to place another fresh sell order.
Our Recommended Broker to buy Ethereum : IQ Option
Best Regulated Broker: IQ Option

IQ Option is the world’s leading EU regulated financial broker based with a revolutionary platform for all traders. Very popular for crypto trading. Read IQOption review
- Best Trading App for Binary Options
- Minimum Deposit of only $10
- Minimum Trade of $1
- Trusted Broker
- $1,000 Virtual Funds ( Demo Account )
- Quick Withdrawals
- Outstanding Platform
- Weekly Tournaments
- Gain up to 92%*
DISCLAIMER

I've been a professional trader for over 5 years.
Currently I work as forex analyst for different investment companies.
- EURUSDWeekly outlook – 7th January 2022 - January 7, 2022
- BTCUSD – Weekly outlook for Bitcoin Price – 23rd December 2021 - December 24, 2021
- USDSGDWeekly outlook for Singapore Dollar – 17th Dec 2021 - December 17, 2021