
BTCUSD Weekly Review; Bitcoin still on course to break the 11918 resistance
Contents
The BTCUSD is still on course to break its resistance at 11918. All eyes should be on this level for the coming week. Every bitcoin broker listing the pair shows that the prices are on the rise.
Although the prices seem to be consolidating around 11470 for the last three days investors are anticipating the bitcoin price to continue with its upward trend. This is especially due to the formation of the bull hammer on 4th.
The bull hammer at least confirms that the chances of the prices assuming a down trend are very minimal. The hammer indicates a power struggle between forces forcing the market down and those forcing the market up; and those forcing it up seem to have overcome.
Daily chart

From the daily chart above, although the hammer shows a probable upward trend, the up trend isn’t that strong according to Ichimoku cloud indicator. Looking at Ichimoku cloud, you will realise that the current color of the cloud is red and the red cloud line is above the green cloud line. This shows that the current daily trend is downward. However, the bearish daily trend isn’t very strong since the candlesticks price are still within the cloud rather than being below it.
But if you go ahead and look closely, you shall realize there is a price divergence and currently the prices are closer to the lower support. This gives the bitcoin price a wide daily range for moving upward to the resistance (the top line of the resistance).
The moving average on the other hand indicates a strong bullish trend since the price is above it. This provides a clear indication to buy bitcoin.
However, it would be advisable to keep your eyes on the 11918 resistance if you buy bitcoin at this juncture. For the short term traders, a take profit at 11918 would help in case the prices decide to bounce back after hitting the resistance.
Weekly Chart
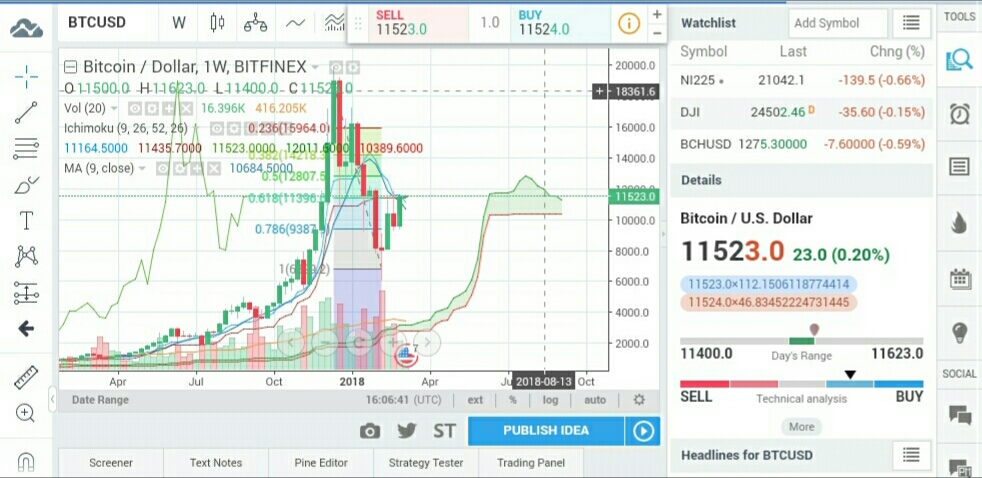
Using the weekly chart, you will realize that bitcoin price has made significant retracement on the previous downtrend during the month of January. Currently, the pair has retraced back to about 61.8%. This is way above the 50% level, thus showing that the chances of full retracement are very probable.
With an average daily range of about 200, the pair is expected to go past the 11918 level within the next 3 days. You will realize there were two bearish hammers that have formed during the current market trend and the market have literally ignored them.
Our Recommended Bitcoin Broker : IQ Option
Best Regulated Broker: IQ Option

IQ Option is the world’s leading EU regulated financial broker based with a revolutionary platform for all traders. Very popular for crypto trading. Read IQOption review
- Best Trading App for Binary Options
- Minimum Deposit of only $10
- Minimum Trade of $1
- Trusted Broker
- $1,000 Virtual Funds ( Demo Account )
- Quick Withdrawals
- Outstanding Platform
- Weekly Tournaments
- Gain up to 92%*
DISCLAIMER

I've been a professional trader for over 5 years.
Currently I work as forex analyst for different investment companies.
- EURUSDWeekly outlook – 7th January 2022 - January 7, 2022
- BTCUSD – Weekly outlook for Bitcoin Price – 23rd December 2021 - December 24, 2021
- USDSGDWeekly outlook for Singapore Dollar – 17th Dec 2021 - December 17, 2021