
BTCUSD Analysis for Bitcoin Broker
Contents
Introduction
The crypto spring is finally here, following a sudden bullish surge in Bitcoin price on a global scale and on IQOption, a major crypto platforms. Speculative adoption is on the increase as well increase in institutional investment. Read on for more detailed analysis of the important news, events and technical price patterns that shows the market sentiments.
Bitcoin Fundamentals
Bitcoin: In the news
Crypto Invest Summit 9 April 2019
The Crypto Invest Summit (CIS) scheduled between 09 and 10 April 2019 is a foremost conference centered on players in the blockchain technology, such as developers, investors, and entrepreneurs. The event will be presented by a couple of leading innovators and leaders in the blockchain ecosystem.
The event will be taking place at the LA Convention center 1201 Figueroa Street Los Angeles CA 90015.
Crypto Tax Software: Integration of CryptoTrader.Tax with Turbotax
Based on a press statement on April 04 ’19, CryptoTrader.Tax, a cryptocurrency centered tax software is successfully integrated with Intuit Turbo Tax, another leading American tax software following the 15th April deadline for listing taxes in the US. The new service will enable users to import trading data directly from major bitcoin broker and exchanges alike, such as Poloniex, Gemini, and Coinbase.
BTCUSD Monthly View

The presence of sellers in the form of double bearish pressure (December 2018 and January 2019), at the base of a prolonged bearish trend, highlights the oversold view of Bitcoin.
Towards the end of Q1 2019, the monthly chart has shown prospects of triggering a bullish accumulation at the closing price of the month of March. The price eventually closed within the high/low range of February and a change in trend polarity is birthed from the bullish accumulation which led to price skyrocketing beyond $5000.0.
BTCUSD: Weekly Chart

The weekly chart, following a prolonged crypto winter, engaged a sudden price surge above bearish pressure zone on December 17 ’18. A correction of the bullish volatility ended after which the Bitcoin price registered a series of continuous bullish closing weekly candles as shown above.
BTCUSD: Daily Chart
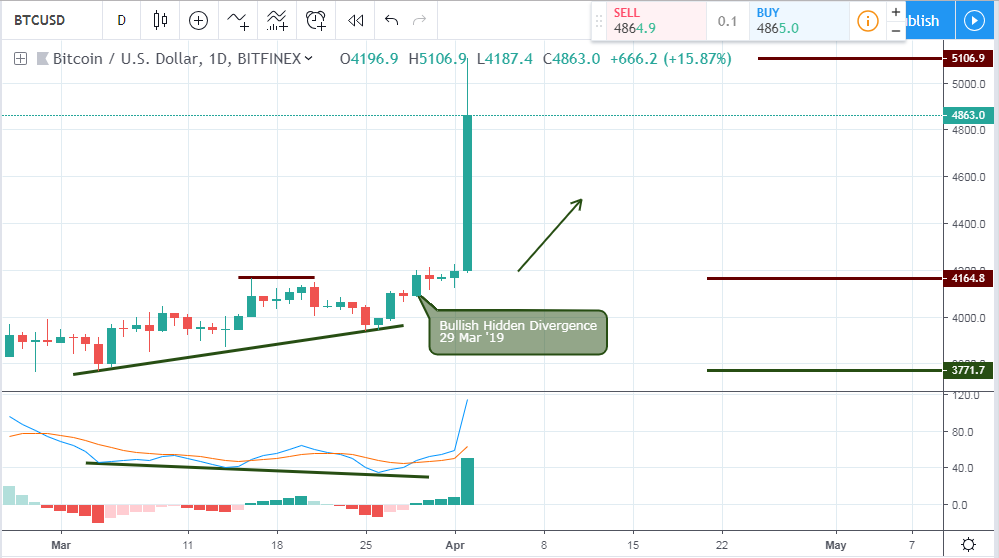
From a daily chart viewpoint, the BTCUSD on March 05 ’19 triggers a bullish Fakey pattern. The bullish hidden divergence indicated on 29 March ’19 was confirmation to the long-awaited increase in volatility.
BTCUSD: H4 Chart
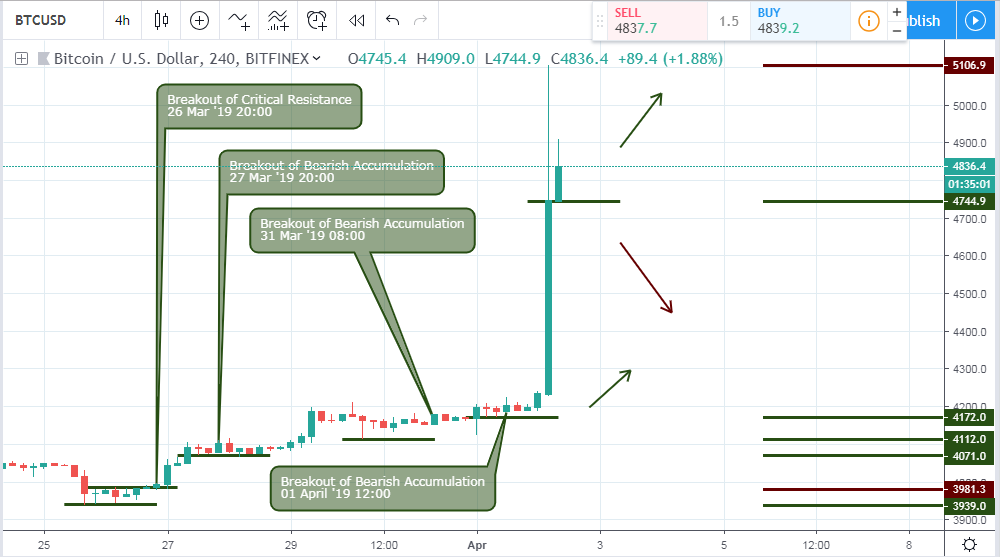
All attempts to restore the bearish trend by sellers failed to persistent buying pressure on March 26 ’19, all the way to the first day in the second quarter of 2019. This resulted in about a 27% increase in the Bitcoin price.
(BTC) Bitcoin Major Resistance Zones
4-Hour
5106.9, 4166.8, 4146.9
Daily
5335.5, 5106.9, 4164.8
Weekly
5659.5, 6741.4, 7788.0
Monthly
4384.0, 4218.0, 7429.2, 7788.0
(BTC) Bitcoin Major Support Zones
4-Hour
3939.0, 4071.0, 4112.0, 4172.0 4744.9
Daily
3761.2, 3767.0, 3869.3, 3948.4
Weekly
3773.3, 3761.2, 3223.4, 3215.2
Monthly
3215.2, 3767.0, 3003.0, 1826.2
Conclusion and Projection
The bullish accumulation pattern triggered on 03 April 2019 is a significant level to lock in some profit, while we wait for a failure of bearish accumulation patterns on the lower 4hour and the same daily chart. A collapse of the bullish accumulation support of 4842.2 will signal a retracement of the current Bitcoin gains.

I've been a professional trader for over 5 years.
Currently I work as forex analyst for different investment companies.
- EURUSDWeekly outlook – 7th January 2022 - January 7, 2022
- BTCUSD – Weekly outlook for Bitcoin Price – 23rd December 2021 - December 24, 2021
- USDSGDWeekly outlook for Singapore Dollar – 17th Dec 2021 - December 17, 2021
Tagged with: btcusd