
BTCUSD Outlook & Technical Analysis for Bitcoin
Contents
Introduction
The Bitcoin BTC closed bearish last week on all bitcoin broker terminals, signaling a technical inside-bar price pattern. Bullish sentiment managed to keep the BTCUSD price above the $9K round-number support in the face of low volatility during the weekend.
This week, we advance to analyze the significant technical and news events driving the price of the number one cryptocurrency.
Bitcoin: In the news
Argentina’s Apex Bank Bans Purchase of Bitcoin Using Credit Cards
The Central bank of Argentina (BCA), on October 31, announced the ban of credit card use for Bitcoin BTC and other cryptocurrency/ altcoin purchases. The development comes on the hills of the recent move by the bank that imposed limits on the purchase of dollars.
In a communique addressing several industries including Credit Card and its use, the BCA announced that acquisition of Bitcoin and cryptocurrencies were to be done only through funds transferred from bank accounts.
According to the BCA, they put these new measures in place to preserve the country’s FX reserve. Experts believe that the move by the apex bank is intended to block entry of dollars into the country, as it seeks to have stronger exchange control.
BTCUSD Long term Projection: Bullish Correction Phase
BTCUSD Technical Analysis
Monthly Chart

Last month closed bullish, bouncing off the MA-9 and hinting an end to the correction phase of the BTCUSD. An end to the correction wave-2 implies the start of the impulse wave-3 of the Elliot wave strategy, which is generally the most extended wave in the cycle.
Weekly Chart

The bearish resistance level $8531.25 gave in to an increase in buy power after the Bitcoin to dollar price failed to close below the $7714.70 support level, increasing the bullish sentiment towards the leading cryptocurrency (BTC).
Last week’s bearish closing inside-bar pattern shows the pair is in a correction phase, and a further break above the new resistance level signifies a move to attain fresh peaks in the last months of the year.
BTCUSD Medium Term Projections: Bullish
Daily Chart
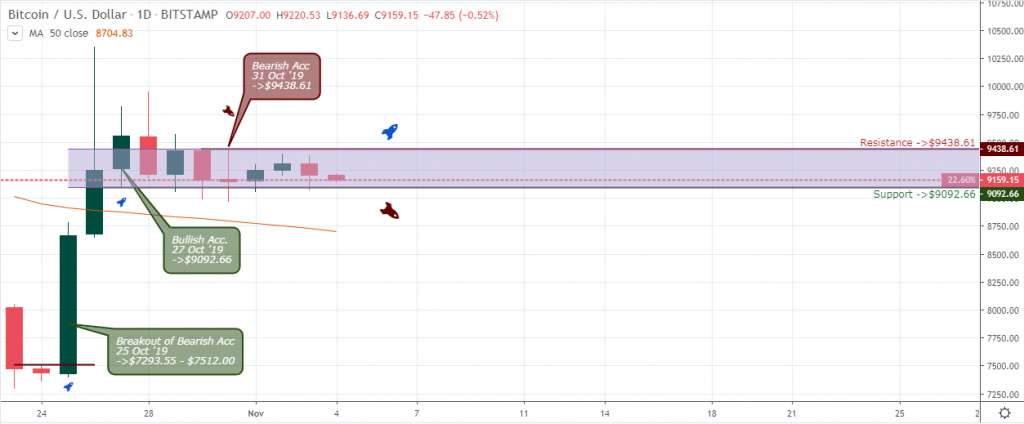
Bitcoin BTC now corrects gains from last month’s price surge after setting a local high at $10350.00. The BTCUSD trades above the MA-50 and within a horizontal channel with support and resistance placed at $9092.66 and $9438.61. A future breach of either of these levels will set the trend direction of the BTCUSD.
H4 Chart
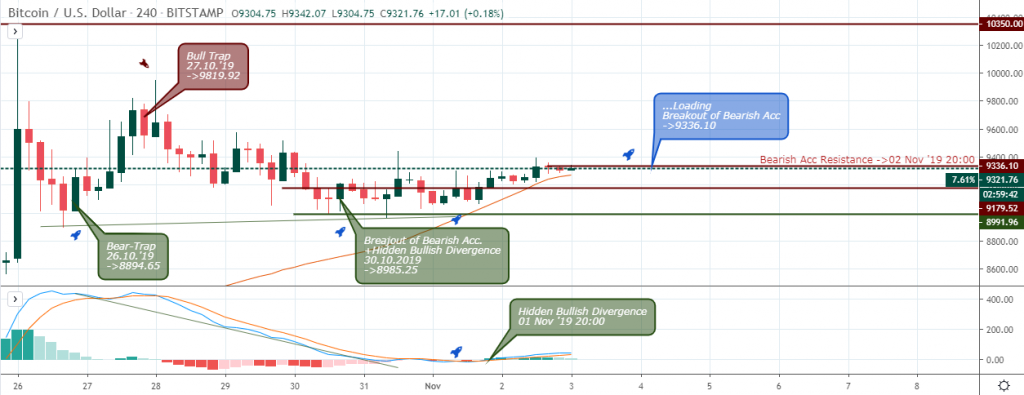
The bull-trap pattern on October 26 stops the further price decline of Bitcoin BTC and a bottoming of the correction phase. A buildup of buying power crush through resistance levels on October 30 and sets the ball rolling for a further price increase.
H1 Chart
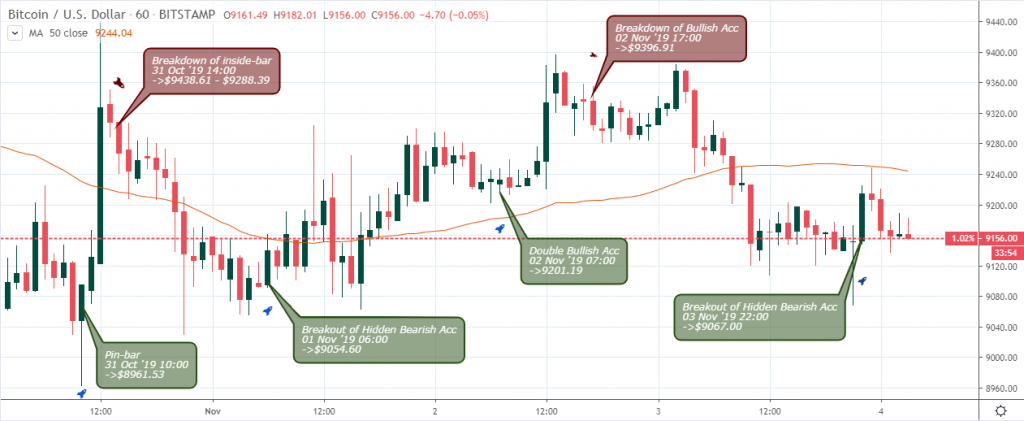
A recent increase in buying power threatens to break the Bitcoin price out of the intraday channel that started from October 31. The BTCUSD pair at publication time increased by 3.3% and threatens to attain new highs.
Conclusion and Projection
A rejection of significant resistance levels across multiple timeframes shows that we could expect a further hike in the Bitcoin price across Singapore broker web terminals as we enter the last day in the year.

I've been a professional trader for over 5 years.
Currently I work as forex analyst for different investment companies.
- EURUSDWeekly outlook – 7th January 2022 - January 7, 2022
- BTCUSD – Weekly outlook for Bitcoin Price – 23rd December 2021 - December 24, 2021
- USDSGDWeekly outlook for Singapore Dollar – 17th Dec 2021 - December 17, 2021