Analysis Of Ethereum chart and why we think you should buy Ethereum
Contents
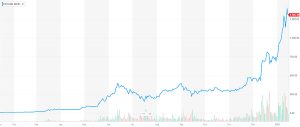 Ethereum price surges to an all-time high of $1400 on some major exchanges, with market capitalization rising from $95 Billion to over $125 Billion U.S. dollars. The smart contract et al cryptocurrency has recovered its number two place as most valuable Altcoin, overtaking Ripple in the race for dominance by an approximate $60 billion. Other cryptocurrencies such as Bitcoin, Lisk and Tronix either plunged in price against the dollar or remained in a sideways market. In this article I will like to share my reason both technical and fundamentals, on why I think you should buy Ethereum.
This sudden rise was a follow up of a couple of fundamental events that took place late last year, however, the most recent was an interview of Vitalik Buterin by Julie Maupin on 8th this week. Vitalik talked about web 3.0 vision where Ethereum with a combination of some other technologies can bring about a more decentralized internet, thereby putting more control in the hands of the user. The web 3.0 vision is made up of Ethereum as a decentralized database, Whisper as a decentralized messaging; and Swarm as a decentralized content hosting etc.
He further mentioned the upcoming transition to Casper proof of stake which would bring about a change in the incentive structure and scepticism around centralization by high stakeholders.
Last year alone, Ethereum price has seen a rise of about 13000% with increasing volume. This week, most of the volumes traded are from the South Korean exchange Bithumb with 9.75%, followed by Binance exchange from China. Other exchanges GDAx and Bitfinex, doing an approximate 5% volume.
Other than the optimistic interview with Vitalik and a continuous increase in volume, there has been a rumour of a hard fork coming up by the end of this month. As we know hard forks come with free coins, which a lot of speculators are looking to cash in on.
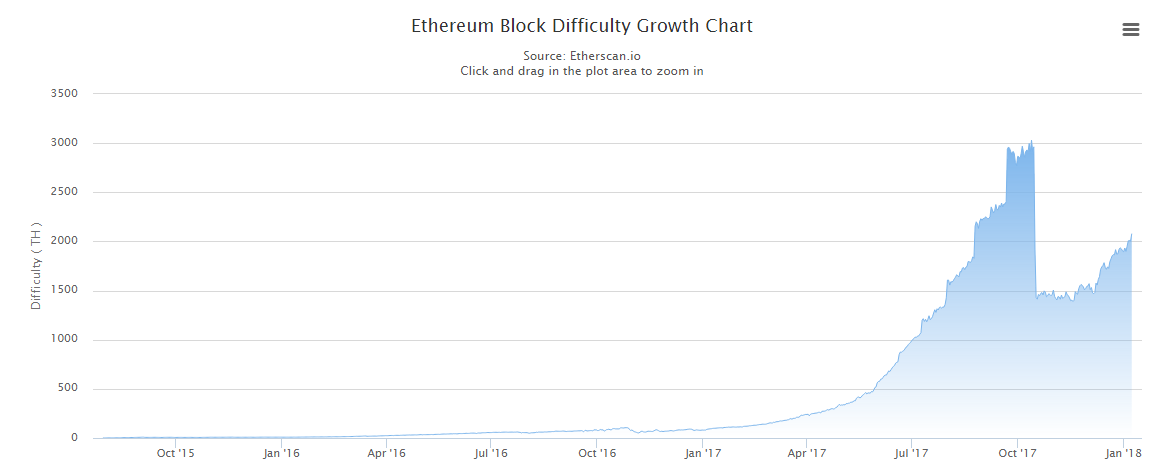
The laws of supply and demand are at works here; with a steadily rising block difficulty as shown in the charts below, and huge pending transactions. It again indicates a huge demand and decline in the supply of the currency. We could expect to see the price increase continue because once the mining difficulty goes up as Ethereum profitability increases, it doesn’t usually come down while it still remains bullish. Miners and speculators alike are risk-averse on Bitcoin holdings.
Ethereum, and ICO launching platform
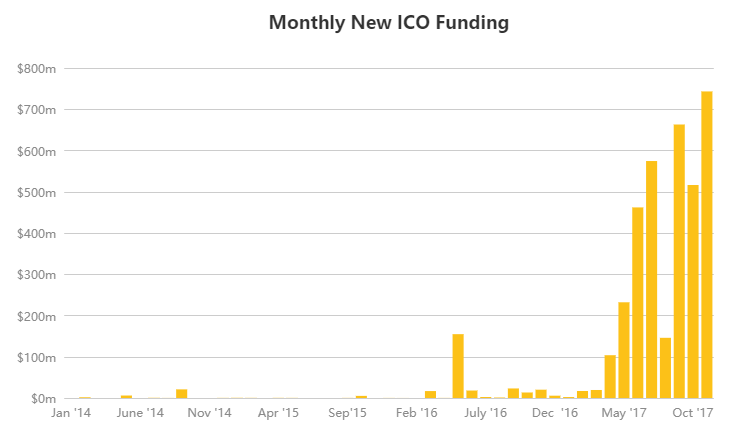
As shown in the chart below, the monthly new ICO funding according to CoinDesk ICOtracker continues to see a continuous rise in price.
ETHEREUM BLOCK DIFFICULTY GROWTH CHART
BITCOIN HOLDERS ARE BECOMING RISK AVERSE
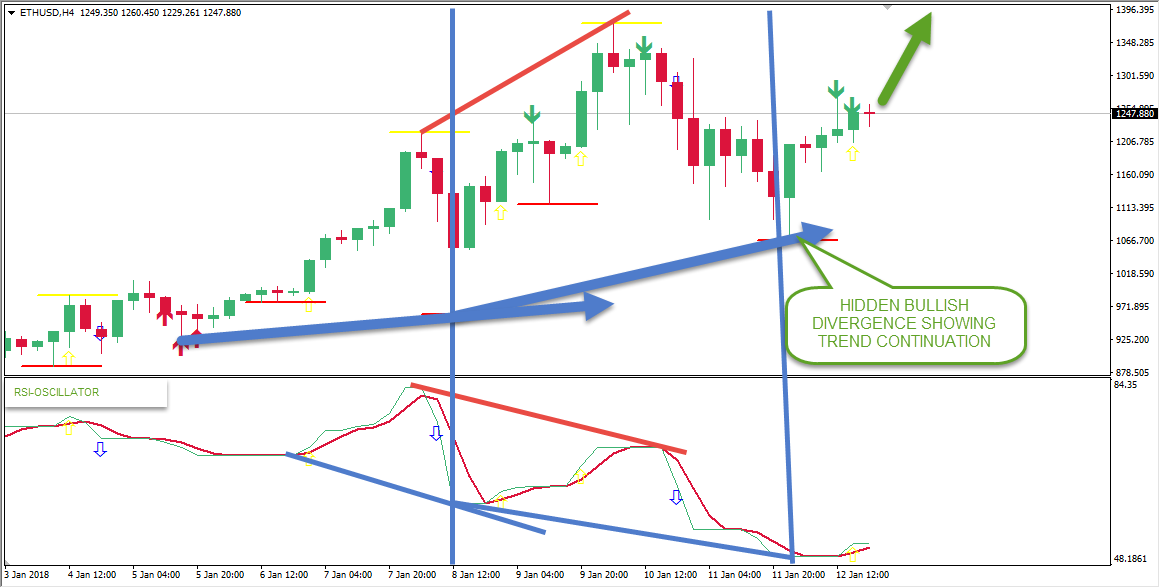
Let’s zoom a little closer into the four hourly [H4] Ethereum chart ETHUSD pair; it’ really been a rollercoaster as we see the formation of divergence patterns. The week started with a hidden bullish divergence which is a comparison of the Ethereum price chart to the RSI-Oscillator on the 8th. Here price formed a higher high, compared to the oscillators lower low, signalling a surge in price. Still continuing into the week, the ETHUSD pair again signalled a regular bearish divergence pattern on the 10th, which indicates a correction or weakness of the pair, establishing the all-time high at $1400.
As the week winds down to a close, a more recent hidden bullish divergence setup is signalled on the 12th, just a couple of hours from now. This indicates an end to the price correction of the Ethereum vs. U.S. Dollar chart on the 10th of this week. The pair is set to resuming its bullish run, shooting pass its current all-time high of $1400 so you can confidently buy Ethereum within the price range of $1200 and $1400.
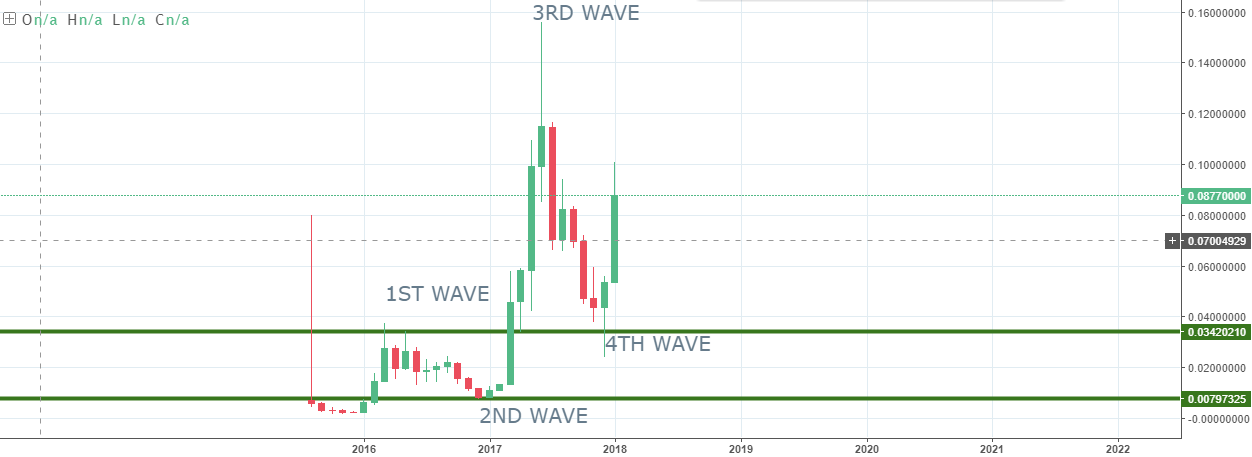
TECHNICAL ANALYSIS: ETHEREUM vs. U.S. Dollar THIS WEEK
Let’s zoom a little closer into the four hourly [H4] Ethereum chart ETHUSD pair; it’ really been a rollercoaster as we see the formation of divergence patterns. The week started with a hidden bullish divergence which is a comparison of the Ethereum price chart to the RSI-Oscillator on the 8th. Here price formed a higher high, compared to the oscillators lower low, signalling a surge in price. Still continuing into the week, the ETHUSD pair again signalled a regular bearish divergence pattern on the 10th, which indicates a correction or weakness of the pair, establishing the all-time high at $1400.
As the week winds down to a close, a more recent hidden bullish divergence setup is signalled on the 12th, just a couple of hours from now. This indicates an end to the price correction of the Ethereum vs. U.S. Dollar chart on the 10th of this week. The pair is set to resuming its bullish run, shooting pass its current all-time high of $1400 so you can confidently buy Ethereum within the price range of $1200 and $1400.
CONCLUSION
From the analysis of the Ethereum chart and following the happenings this week, Ethereum has continued to show optimism and we expect to see a continuation of this bullish move into the first quarter, and possibly to the end of the year.
Our Recommended Ethereum Brokers to trade ETHUSD:
Best Regulated Broker: IQ Option

IQ Option is the world’s leading EU regulated financial broker based with a revolutionary platform for all traders. Very popular for crypto trading. Read IQ Option review
- Best Trading App for Binary Options
- Minimum Deposit of only $10
- Minimum Trade of $1
- Trusted Broker
- $1,000 Virtual Funds ( Demo Account )
- Quick Withdrawals
- Outstanding Platform
- Weekly Tournaments
- Gain up to 92%*
DISCLAIMER

- EURUSDWeekly outlook – 7th January 2022 - January 7, 2022
- BTCUSD – Weekly outlook for Bitcoin Price – 23rd December 2021 - December 24, 2021
- USDSGDWeekly outlook for Singapore Dollar – 17th Dec 2021 - December 17, 2021
Tagged with: ethereum • ethusd

