
ETH/USD weekly outlook for Ethereum broker
- Ethereum Price is on the rise once again after a major downslide.
- It has maintained a bullish trend for two weeks consecutively now.
- Every Ethereum broker is now banking on the crypto-fiat currency pair to resume its glory in the coming months.
ETH/USD made a bold 12.53% appreciation over the last two weeks breaking the monotonous bearish trend that has dominated the crypto-fiat currency pair for the last three months consecutively. The pair is slowly regaining its bullish trend strength. Unless any major worse thing happens, Ethereum price will move higher over the next coming months considering the efforts being put in by the development team to ensure that Ethereum gets to the top of the cryptocurrency list in terms of services and features.
Actually, as we speak, the only thing keeping Ethereum at number two in the cryptocurrency rating is the fact that Bitcoin was developed earlier and it was far more developed by the time Ethereum was being launched. Also, Ethereum received a setback after the hard fork that split Ethereum Classic (ETC) and Ethereum (ETH) at the early stages of development.
Looking at different time frame charts:
Daily Chart

The daily chart clearly shows that the Ethereum price is slowly gaining momentum of a bullish trend. For the last five days, the trend has been bullish despite the fact that there was a doji candlestick formation three days ago.
By assuming the doji, the market has proved that the momentum or the force pushing the market for a bullish trend is quite high and it is not stopping any time soon.
By looking at the moving average, you shall notice that the candlesticks have crossed the moving average line on their way up. This is another confirmation that the bullish trend is strong.
Which short term trade to place?
It is the perfect time for a short term day trader to place a buy order. Actually, the current candlestick being formed is the second candlestick since the price crossed the moving average. This is usually the best time to place an order since the second bullish candlestick has proved the bullish trend.
For the first buy order placed at the current price, the trader should place his/her target at the Pivot point P at 546.43. With this, the trader can be guaranteed of about 126 points profit. Then the stop loss should be at 266.26, the previous S2 (Support Level).
Weekly Chart
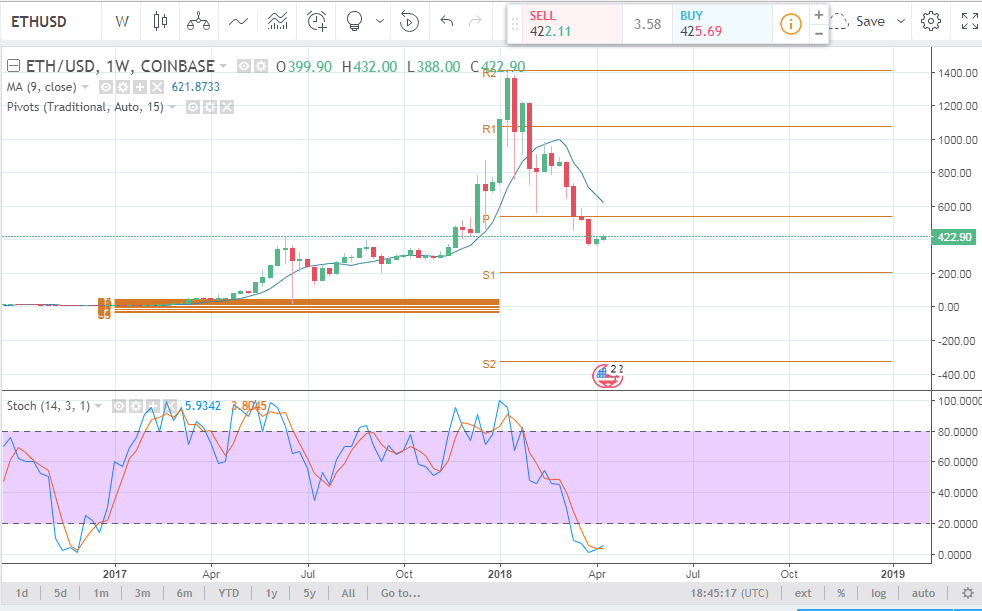
For the long term traders, the weekly chart analysis is the best. From the chart, it is also evident that the pair is slowly assuming a bullish trend.
Looking at the Stochastic Indicator (14,3,1), it is evident that the blue line is just getting above the red line and it is just at the point of turning upwards. By this time the price will have hit the pivot point P and the trader can then perfectly rely on the R1 as his/her target point.
For the long term traders, it would be wise to wait for the candlesick to get above 20. This would be the perfect point to place a buy the pair.
Our Recommended Ethereum Broker : IQ Option
Best Regulated Broker: IQ Option

IQ Option is the world’s leading EU regulated financial broker based with a revolutionary platform for all traders. Very popular for crypto trading. Read IQOption review
- Best Trading App for Binary Options
- Minimum Deposit of only $10
- Minimum Trade of $1
- Trusted Broker
- $1,000 Virtual Funds ( Demo Account )
- Quick Withdrawals
- Outstanding Platform
- Weekly Tournaments
- Gain up to 92%*
DISCLAIMER

I've been a professional trader for over 5 years.
Currently I work as forex analyst for different investment companies.
- EURUSDWeekly outlook – 7th January 2022 - January 7, 2022
- BTCUSD – Weekly outlook for Bitcoin Price – 23rd December 2021 - December 24, 2021
- USDSGDWeekly outlook for Singapore Dollar – 17th Dec 2021 - December 17, 2021
Tagged with: ethusd