
Weekly Outlook of ETHUSD – Buy Ethereum on IQOption
Contents
After a month long retracement following the super hike in December 2017, the ETHUSD has now started its way back to the upward trend again. The uptrend is slowly gaining traction and soon it will be really strong if things remain as they are with any major interruptions.
Daily chart

From the daily chart above, it is evident that the ethereum price is pushing the US dollar up again. From the chart, this is after a short downward trend which was a retracement from the sudden surge in the prices at the end of the year 2017.
However, this retracement that lasted for about a month was starting to get traders as well as investors a bit worried. Most cryptocurrency traders opt for long term trades and some had become too” cozy” with the upward trend during December and the down trend in January caught most by surprise. Most were hoping that it was just for a short time, but the short time ended up being one month.
But the time has come to buy Ethereum once again. The trend is common across every Ethereum broker exchange platform.
Looking at the Retracement levels of the last downtrend, we can see that at the moment, the retracement is just about 23.6%. Meaning the Uptrend is still quite “young” and we can’t really talk of a strong uptrend as per now yet.
But if you look closely, you will be able to notice that the market has formed a symmetrical triangle pattern and the prices are more likely to break on the upside. If that happens, traders will be guaranteed that the Ethereum price is set for a higher level. And this will be the best time for long term traders to buy Ethereum.
After the breakout, traders should then set their eyes on the resistance level at 976.00. If the prices break that, then the next one should be at 1214 and lastly the one at 1385.
If the prices manage to break all these resistance levels, traders should be sure the ETHUSD has resumed its upward trend completely.
Weekly Chart
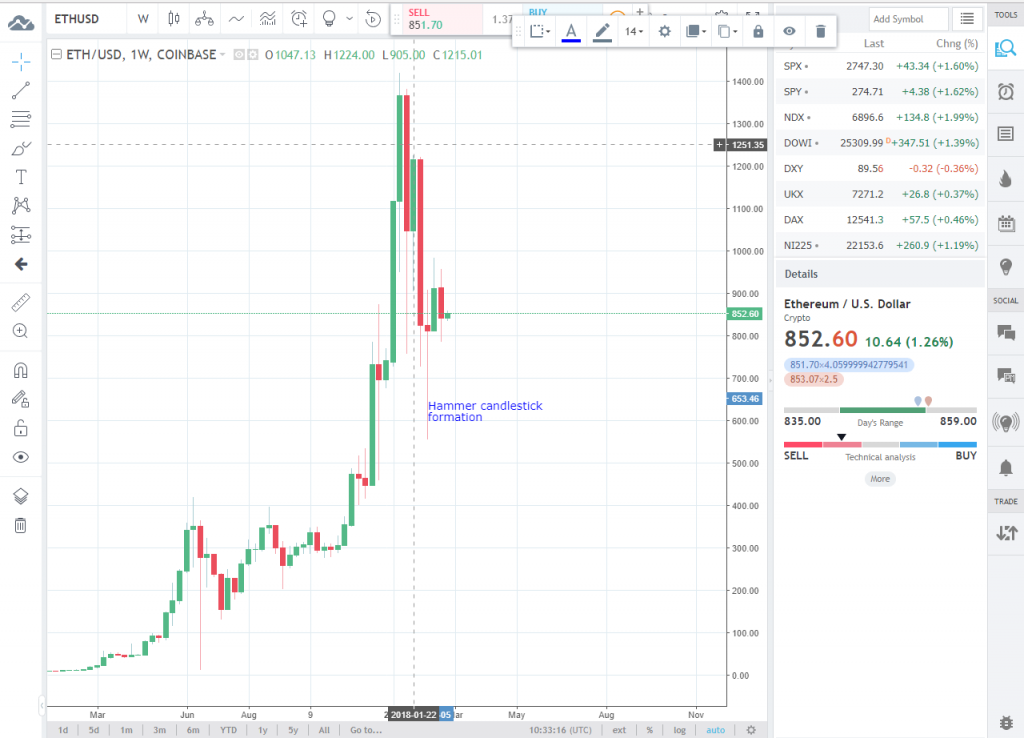
For a better view of the price movements, you can go to the weekly chart of your Ethereum broker. You will see that ethereum is really struggling even after the formation of the hammer candlestick in the last third week. Although the hammer candlestick indicates a probable uptrend, it would be wise to confirm the trend as we have seen using the daily chart above.
For a long term trade, it is advisable to wait for the breakout from the daily chart symmetrical triangle pattern to occur so as to place a long buy.
And as seen from the pattern drawn on the daily chart, the breakout is expected to occur very soon. Actually, we shall not see the end of this week before it happens. So it’s just a matter of time. So don’t get tired of waiting. Patience pays!
Our Recommended Bitcoin Broker to buy Ethereum: IQ Option
Best Regulated Broker: IQ Option

IQ Option is the world’s leading EU regulated financial broker based with a revolutionary platform for all traders. Very popular for crypto trading. Read IQOption review
- Best Trading App for Binary Options
- Minimum Deposit of only $10
- Minimum Trade of $1
- Trusted Broker
- $1,000 Virtual Funds ( Demo Account )
- Quick Withdrawals
- Outstanding Platform
- Weekly Tournaments
- Gain up to 92%*
DISCLAIMER

I've been a professional trader for over 5 years.
Currently I work as forex analyst for different investment companies.
- EURUSDWeekly outlook – 7th January 2022 - January 7, 2022
- BTCUSD – Weekly outlook for Bitcoin Price – 23rd December 2021 - December 24, 2021
- USDSGDWeekly outlook for Singapore Dollar – 17th Dec 2021 - December 17, 2021
Tagged with: ethereum • ethereum broker • ethereum price