
Weekly SGDUSD analysis
Contents
Any Singapore broker will tell you that the Singapore dollar is getting stronger day by day. The currency is strengthening after a major decline from July 2011 to December 2016.
From 2011 to 2016, the pair registered a continuous bearish trend all through, although there were some minor upward retracements here and there. However, for the whole of last year, the SGDUSD pair has registered a bullish trend to date.
Weekly chart

Using the Ichimoku bands and moving average indicators, you will notice that the SGDUSD currency pair has a very strong bullish trend. The prices are well above the moving average as well as above the green Ichimoku band.
The green Ichimoku band line is also above the red band line. Every sign shows that it is time to buy the pair. Singapore brokers are showing all systems go for a BUY.
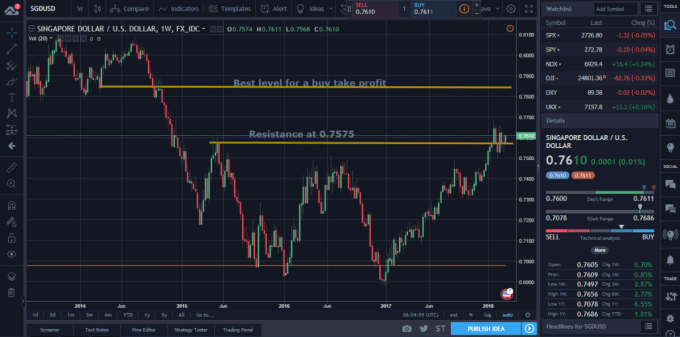
Considering that the market price has already crossed the resistance of 0.7575, a long term trader can place his/her take profit at the next resistance level of 0.7845. This would be such an opportunity.
I know you may get worried about the current market consolidation that has been taking place for the past 6 weeks.
Market consolidations are not good signs at all, they here traders have to be very alert since the market may make up its “mind” to move in any direction. It is usually like a time of decision making!
Luckily, for our case there was the formation of a hammer candlestick last week and the long tail is on the lower end; indicating a probable continuation of the bullish trend.
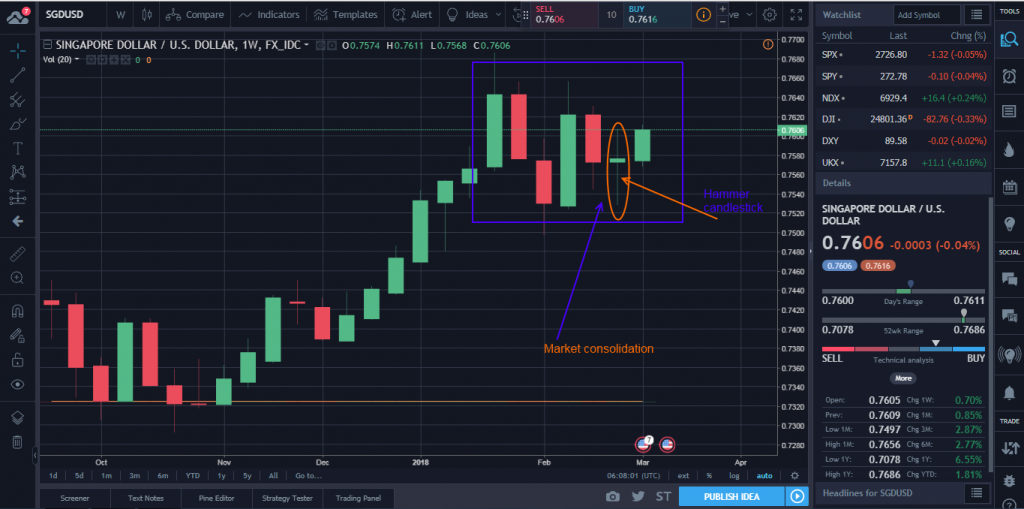
Actually, if you look at the next candlestick to form after the hammer, you will realise that it is a bullish candlestick which is also quite long. If the next candlestick closes as a bullish candlestick, then it would be confirmed that the bullish trend is continuing.
Daily chart
For the sake of the day traders, let’s look at how the market is behaving during the day also.
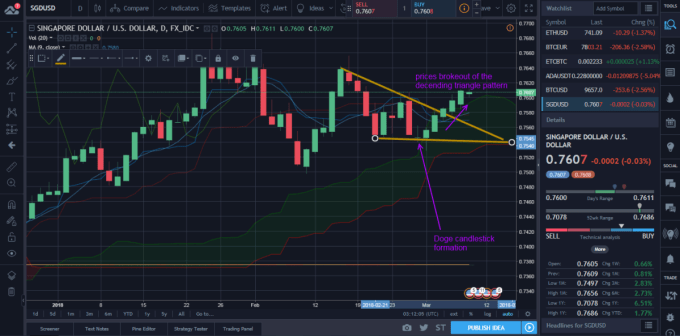
The SGDUSD daily chart shows a lot of market swings which are very healthy for day traders. Applying ichimoku and moving average indicators, you will realise that the market trend is a week bullish trend since the market prices just got out of the ichimoku’s green band.
Also, if you draw a triangle pattern using trend lines, you will get a descending triangle pattern which the market prices broke out three days ago.
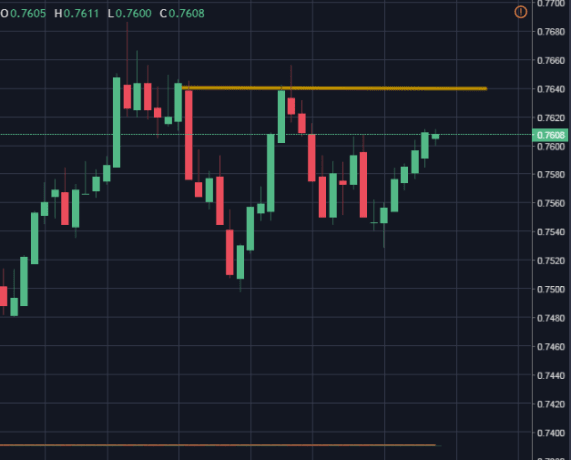
A day trader can place a buy order at the current price targeting the 0.7640 resistance level.
Our Recommended Singapore Broker to trade SGDUSD
Best Regulated Broker: IQ Option

IQ Option is the world’s leading EU regulated financial broker based with a revolutionary platform for all traders. Very popular for binary options & crypto trading. Read IQ Option review
- Best Trading App for Binary Options
- Minimum Deposit of only $10
- Minimum Trade of $1
- Trusted Broker
- $1,000 Virtual Funds ( Demo Account )
- Quick Withdrawals
- Outstanding Platform
- Weekly Tournaments
- Gain up to 92%*
DISCLAIMER

I've been a professional trader for over 5 years.
Currently I work as forex analyst for different investment companies.
- EURUSDWeekly outlook – 7th January 2022 - January 7, 2022
- BTCUSD – Weekly outlook for Bitcoin Price – 23rd December 2021 - December 24, 2021
- USDSGDWeekly outlook for Singapore Dollar – 17th Dec 2021 - December 17, 2021