
USD/SGD Weekly Analysis for Singapore Brokers
Contents
Introduction
The Asian Tiger’s Sing dollar made an attempt for a comeback for a single week, only to give in to bulls of the USD. A lot of positive and negative events from both the Asia and American regions have a strong implication on the current direction the USDSGD currency pair is taking. Read on as we continue with another weekly overview of the pair.
Fundamentals
U.S Fundamentals
With fears of trade wars hitting different world markets, the United States stocks, S&P 500 and Dow Jones Industrial Average have risen in a single day. The Standard & Poor’s has made a 4.8% this year. According to Ron Paul, a former Republican Congressman, the current bullish trend of the U.S stock market is in a bubble, and the entire system is built on a shaky foundation. He went on to conclude that the market is in the biggest bubble in history.
Singapore Fundamentals
Following a slight slowing of China’s economy in the second quarter, and with the risk adverse position of investors amidst trade war impact; Asian shares traded lower, of which Singapore is not an exception? On a lighter note, Singapore Telecommunication Ltd adopts a strategy to boost its earnings by starting a gaming league. The gaming industry is one with an estimated global sale of about $3billion USD.
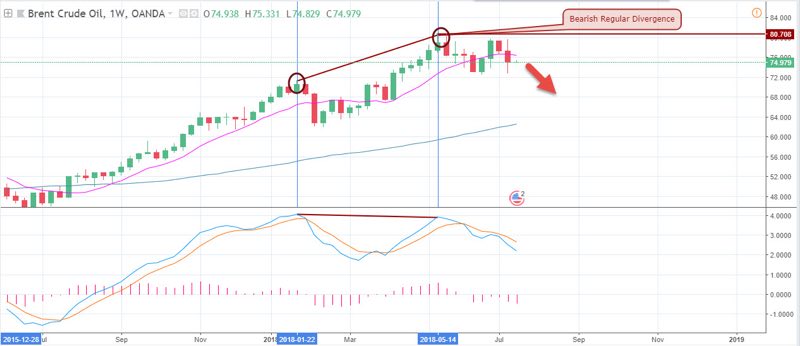
From the above Brent crude oil chart of the weekly time frame, a 0.5% dip was triggered, consequently reflecting on the SGD to USD exchange rate. This is because; a decreasing crude oil price translates to a recovery of the Singdollar.
Technical
If you have been following our series of weekly overviews on trading instruments, you will notice by now that we deploy technical analysis for proper housekeeping on traded markets. It is our best practice to start from the higher time frame to the lowest, as we search for patterns that could give us a glimpse of possible consecutive bullish or bearish candlesticks. Zooming down to the smaller time frames gives us better opportunity to enter trades with little drawdown or maximal adverse excursion.
USDSGD: Monthly Chart

The monthly chart after forming 3 consecutive bullish candles, signify that the pair is still in a bullish trend. The golden cross of the MACD (9, 21, 5) clearly shows this, as price moves out of previous consecutive bearish candlesticks.
USDSGD: Weekly Chart
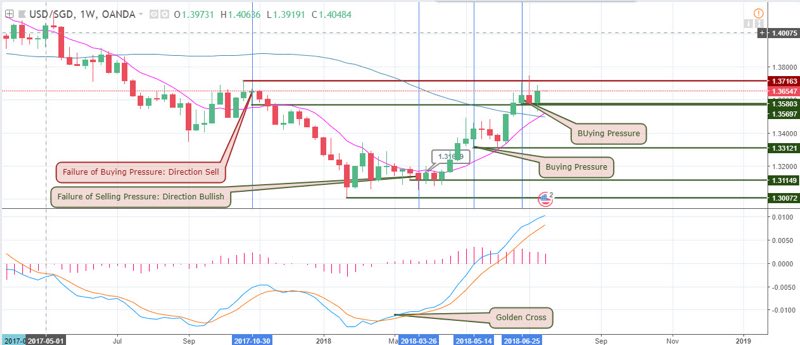
Last week closed bearish with a candle weak longer than the candle body. Despite the bearish shooting star pattern formed, the bearish pattern formed two weeks ago fails to close below the buying accumulation support formed three weeks ago, as price glides above the 65 periods moving average which now serves as a support.
USDSGD: Daily Timeframe
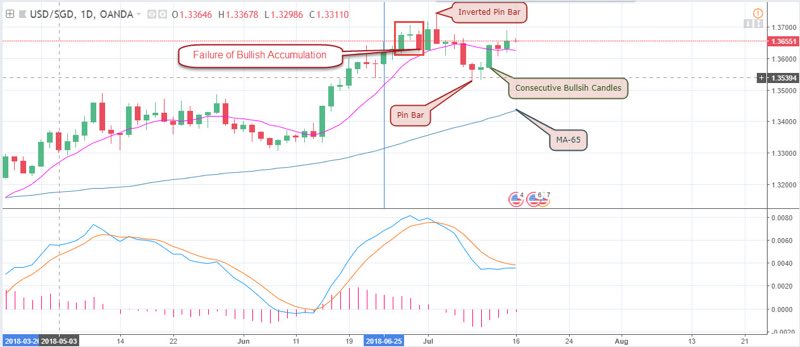
The failure of a bullish accumulation pattern on 29-06-2018 followed by an inverted pin bar pattern on 03-07-2018 are the events that lead to the last week closing bearish. However, a Pin bar pattern formed on 09-07-2018 is responsible for the bullish candle close of last week. This move is expected to continue as a new trading week starts on the 16th.
USDSGD: 4-HOURLY Timeframe
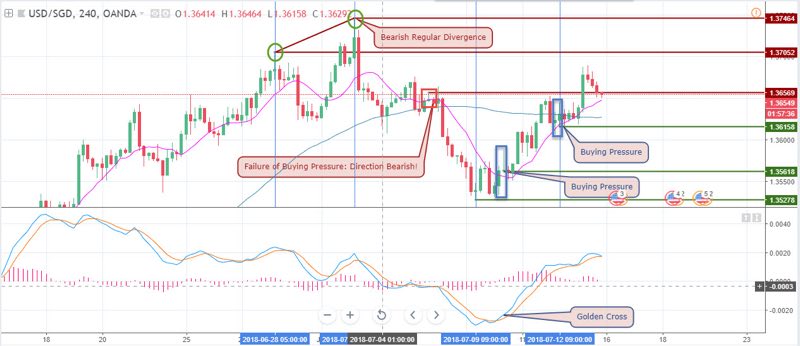
Four hourly chart is where we conclude our entry for the week and enter most of our trades. As shown above, we can see how the bearish divergence pattern triggered a bearish trend, causing a recovery of the SGD to USD exchange rate. The previous week’s bullish move was triggered by a bullish accumulation pattern confirmed around the early hours of 09-072018. Further, into the middle of the week, another buying pressure/accumulation signal gave an opportunity for entering into the bullish trend with a clear signal.
USDSGD: 2-Hour Chart
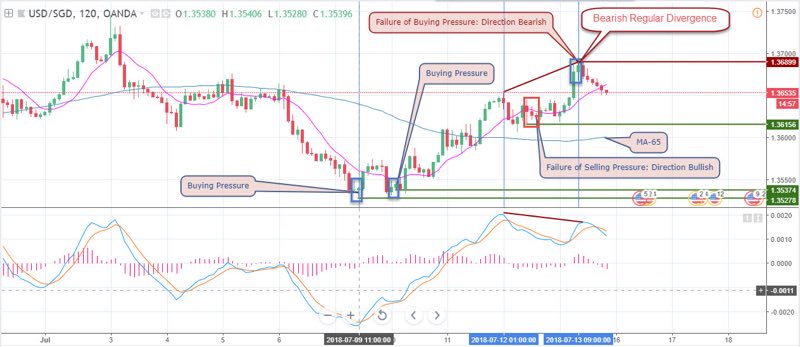
Although we are of the opinion that the USDSGD pair could continue in the upward direction from a weekly and daily, and 4-hour perspective, the above 2-hour chart illustrates a clear bearish regular divergence pattern which we believe has triggered a sell order as a new week opens. This setup is very significant, considering a fact that it is formed after a failure of the buying accumulation on 13-07-2018.
Projection and Conclusion
From a longer time horizon, we expect that most Singapore brokers and traders alike are most bullish on this pair. However, after zooming deeper into the inner price dynamics of the pair, we believe that short-term selling opportunities are offered moving forward into the new week, with stop loss about 20 points above the 1.36899 resistance.
Our Recommended Singapore Brokers to trade USD/SGD
Best Regulated Broker: IQ Option

IQ Option is the world’s leading EU regulated financial broker based with a revolutionary platform for all traders. Very popular for crypto and USD/SGD trading. Read IQ Option Singapore review
- Best Trading App for Binary Options
- Minimum Deposit of only $10
- Minimum Trade of $1
- Trusted Broker
- $10,000 Virtual Funds ( Demo Account )
- Quick Withdrawals
- Outstanding Platform
- Weekly Tournaments
- Gain up to 98%*
Best Binary Options Broker: Olymp Trade

Olymp Trade is an award winning binary options broker with an excellent trading platform support and education tools. Read Olymp Trade Review
- Risk-Free Trades
- Minimum Deposit of only $10
- Max. 90% Payout
- $10,000 Free Demo account
- Free TrainingEducation : 18 Indicators, 7 strategies and 28 webinars 25% Deposit s
- Certified Platform
- Quick withdrawals
Best Binary Bonus: Binomo

Binomo is a regulated binary broker with a wide range of assets to trade and amazing promotions ( bonus, tournaments prizes,..) .Read Binomo Review
- 25% Deposit Bonus ( 100% Bonus VIP accounts )
- Minimum Deposit of only $10
- Minimum Trade of $1
- Max. 95% Payout
- $1,000 Virtual Funds ( Demo Account )
- Weekend trading
- Free training
DISCLAIMER

I've been a professional trader for over 5 years.
Currently I work as forex analyst for different investment companies.
- EURUSDWeekly outlook – 7th January 2022 - January 7, 2022
- BTCUSD – Weekly outlook for Bitcoin Price – 23rd December 2021 - December 24, 2021
- USDSGDWeekly outlook for Singapore Dollar – 17th Dec 2021 - December 17, 2021
Tagged with: usdsgd