
USD/SGD Outlook and Technical Analysis for Singapore brokers
Contents
Introduction
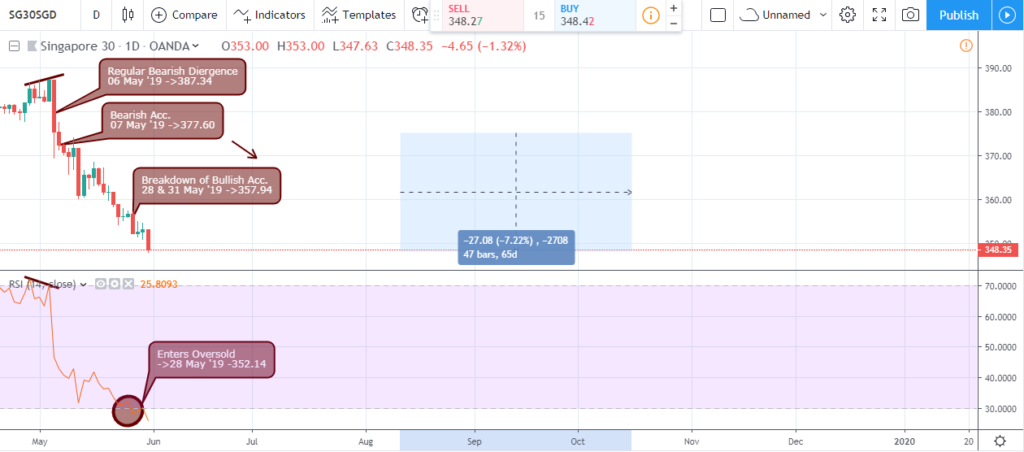
Following an increase in selling pressure on the Singapore30, the Singapore dollar recoiled after a price close below a significant support level from a daily time frame perspective.
Come along as we dive into the indicators driving the trend of the USDSGD.
Singapore Fundamentals
Singapore 30 (SG30SGD): Monthly Chart

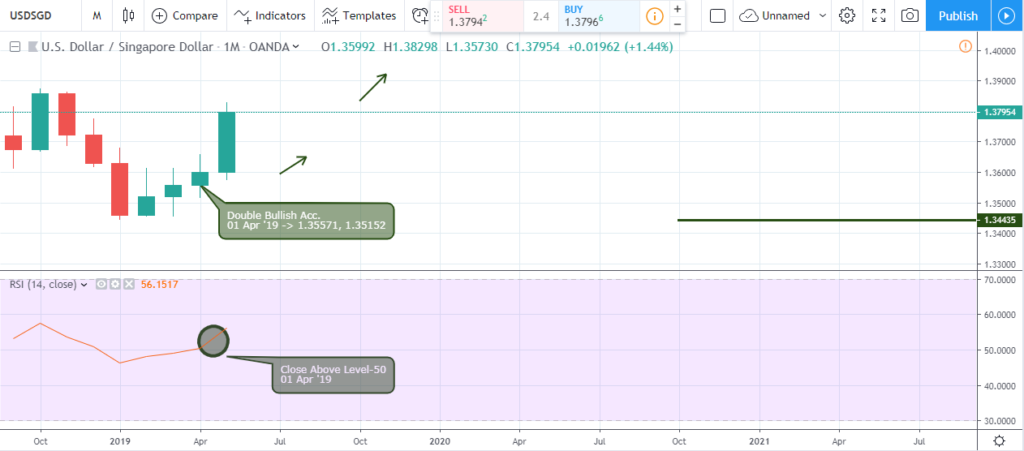
As usual, we carry out a top-down overview of the USD to SGD currency pair. Starting from the monthly time frame, the pair indicated an accumulation of demand and confirmed a price increase on April 01, 2019.
The bulls setup support levels at 1.35571, 1.33152 respectively, and the price was not able to break below these levels.
USDSGD Daily Chart

Following a bullish price rally of about 1.55% that was initialized by a bullish Fakey setup, the foreign exchange rate of the USDSG entered overbought territory on May 16, 2019, and later exited the zone on May 24 after the closing price of 1.38298.
A failure of bullish accumulation support on the same May 24, 2019, reinforced the bearish price decline; however, the bearish volatility was so intense such that it produced a price recoil.
USDSGD H4 Chart

A view from the 4hour time frame presents swing trading setups, starting from a failure of bullish support on May 23, 2019, with resistance established at 1.38298. The price collapse, which was signaled alongside an exit of the overbought zone, resulted in a price decline of about 0.4%.
An opposite break above
selling resistance of 1.37420, brought the bulls back into the game, as the price surged upwards by about 0.65%.
USD/SGD: H1 Chart

From a 1hour chart intraday perspective, we noticed a series of regular bearish divergence on May 22 and 23. The Singapore dollar recovered some of its losses as shown on Olymp Trade platform, after signaling a collapse of bullish accumulation support on May 23, 2019, 09:00.
Conclusion and Projection
Coming to the end of May, the USD/SGD signals a regular bearish divergence (1.38364) on May 29, 2019, 04:00 after exiting the overbought area from a 4hour and daily chart overview.
We look forward to a bearish price decline, as well as swing trading opportunities going forward into the new month.

I've been a professional trader for over 5 years.
Currently I work as forex analyst for different investment companies.
- EURUSDWeekly outlook – 7th January 2022 - January 7, 2022
- BTCUSD – Weekly outlook for Bitcoin Price – 23rd December 2021 - December 24, 2021
- USDSGDWeekly outlook for Singapore Dollar – 17th Dec 2021 - December 17, 2021
Tagged with: usdsgd