
USDSGD Technical Analysis for binary options brokers
Contents
Introduction
Entering the New Year 2019, the Singapore dollar quickly strengthens following a couple of fundamental and technical events. Can this bullish move be sustained? Join us this week as we take a look at these events and how they may affect the Singapore dollar moving forward.
Singapore 30 [SG30SGD]

The last weekly bar of the year 2018 which the December 31 ’18 candle as shown above signaled a bullish accumulation pattern. Scrolling down to the daily chart, a regular bullish divergence was signaled to confirm the bullish campaign of the weekly accumulation pattern. Price from that point shoots up to 5.6%. This indicates bullish sentiment for the Singapore economy
The U.S Dollar: Government Shutdown
Government activities have been brought to a halt as the U.S president, Donald Trump demands funds for the border wall construction. The U.S dollar entered into a rapid bearish spiral across major currency pairs as the shutdown continues for days.
Technical
USDSGD: Monthly Chart
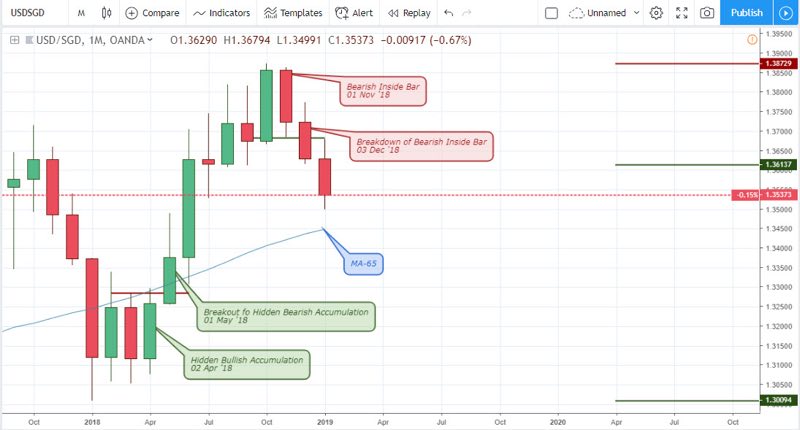
A breakdown of a bearish inside bar on December 3, ’18 confirmed an increase in strength of the Singapore dollar. This is after the bulls have attained a 3.57% profit from a breakout of bullish accumulation on April 2 ’18. The foreign exchange rate of the USDSGD currently trades above and near the MA-65 which could serve as potential support zone for a possible recovery of the USD.
USDSGD: Weekly Chart
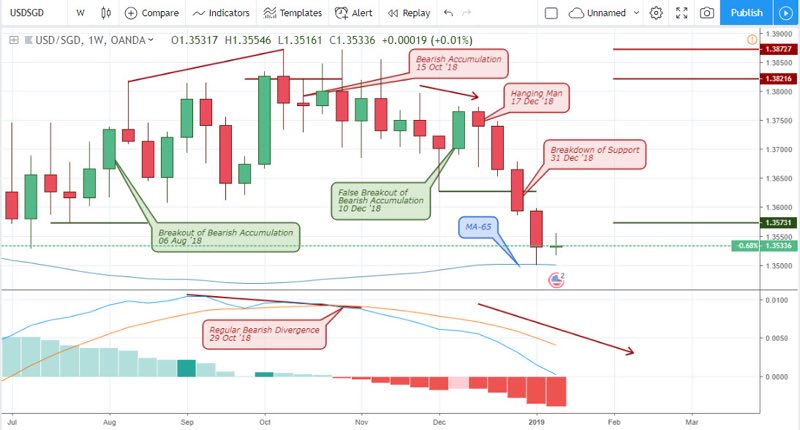
We can’t easily forget the regular bearish divergence pattern confirmed by the formation of the bearish accumulation on October 15 ’18. The resistance level set by this pattern at 1.38216 was able to stand the test of time and slowly drives the pair to a 1.95% price decline, as price tests the MA-65 support.
USDSGD: Daily Timeframe
We can’t easily forget the regular bearish divergence pattern confirmed by the formation of the bearish accumulation on October 15 ’18. The resistance level set by this pattern at 1.38216 was able to stand the test of time and slowly drives the pair to a 1.95% price decline, as price tests the MA-65 support.
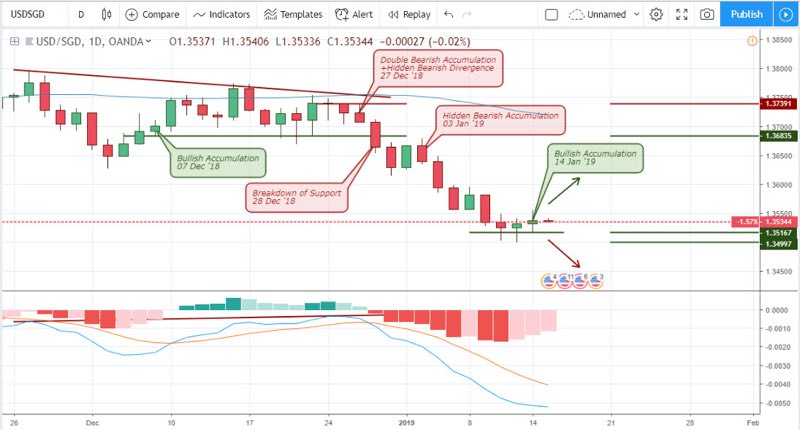
USDSGD: Daily Timeframe
The regular bullish divergence pattern triggered and confirmed by the bullish accumulation pattern on January 10 ’19, confirm the possibility of entering a buy trade from the bullish accumulation on the daily chart. Another bullish accumulation pattern was later triggered on January 11 ’19 10:00, and both support levels at 1.35087 and 1.34992 were not violated and the bullish move should be sustained.
2-HR Chart of the USDSGD
The 2-hour chart of the same pair on major binary options brokers like Olymp Trade signaled a regular bullish divergence pattern, both on January 10 ’19 16:00 and January 11 ’19 14:00. The latter was even confirmed by a failure of bearish accumulation on the same date emphasizing the confidence behind the move. A breakdown of hidden bullish accumulation on January 14 ’19 14:00 has the potential of correcting the short term bullish trend.
Conclusion
From the look of things, bullish sentiment is on the rise considering lower daily, 4hour and 2hour charts. However, the higher monthly and weekly charts are a little bit undecided, although they hover around a critical moving average support. A quick compromise from both parties involved in the U.S government shutdown may result in a recovery of the U.S dollar.

I've been a professional trader for over 5 years.
Currently I work as forex analyst for different investment companies.
- EURUSDWeekly outlook – 7th January 2022 - January 7, 2022
- BTCUSD – Weekly outlook for Bitcoin Price – 23rd December 2021 - December 24, 2021
- USDSGDWeekly outlook for Singapore Dollar – 17th Dec 2021 - December 17, 2021