
USDSGD Outlook and Technical Analysis for Singapore Brokers
Contents
Introduction
The Singapore dollar continues to strengthen against the USD even into the new week on Binomo platform. A move that has been at plat since the collapse of significant support on the long term weekly overview.
Come along as we look at some fundamental and other technical drivers of the USDSGD exchange rate.
Singapore Bank Lending
Bank Lending is a measure of the change in the total value of outstanding bank loans given to businesses and consumers and businesses.
Borrowing and spending are indicators that point to consumer confidence.
A reading that is greater than the forecast data reading should be considered as a positive sentiment for the SGD, while a data reading less than the expected forecast should be deemed as bearish for the currency.
As per the latest data released on September 30, the previous reading was 684.9B, while actual reading was 684.7, signaling a positive inclination for the SGD.
U.S. Pending Home Sales MoM
The NARs (National Association of Realtors) Pending Home Sales Report estimates the difference in the number of homes under contract to be sold while still waiting for the closing transaction. This value excludes new construction.
A reading that is greater than the forecast data reading should be considered as a positive sentiment for the USD, while a data reading less than the expected forecast should be deemed as bearish for the currency.
As per the latest data released on September 26, the previous reading was -2.5%, while actual reading was 1.6%. The Forecast reading was 0.9%, signaling a bearish or negative sentiment for the USD.
USDSGD Technical Analysis
USDSGD Long term Projection: Correction Phase
Monthly Chart

Above is the monthly time frame chart, illustrating a price plunge from the September 02 ’19 monthly opening price of the USD to SGD exchange rate, all the way down to its current low at 1.36023.
The hanging-man pattern at the closing price of September happens to be a significant driving force behind the price plunge, which heads towards the April 01 ’19 support 1.34541.
Weekly Chart

There’s no clear sign of price reversal on the weekly chart, other than the anticipated hidden bullish divergence.
Perhaps a price close above last week’s previous high at 1.36450 may confirm the bullish divergence.
USDSGD Medium Term Projections: Bearish
Daily Chart
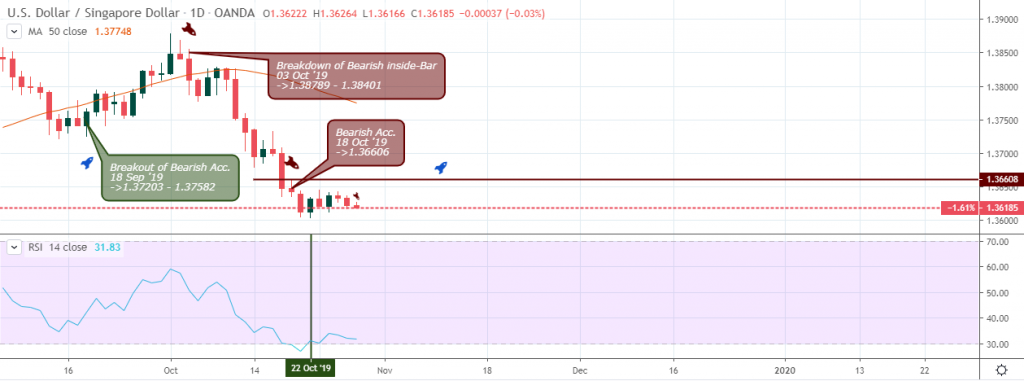
The daily time frame shows the USDSGD foreign exchange exiting the oversold area on October 22 ’19 after a bearish signal on October 18 ‘19. A breach of the 1.36608 resistance implies a trend change to bullish.
USDSGD H4 Chart: Bearish
Finishing off with at the 4hour time frame, the bears broke below the 1.37083 support to favor the Singapore dollar.
A hidden bearish divergence pattern on October 25 05:00 and an increase in sell pressure on October 28 01:00 set new bearish outlook for the Greenback against the Singapore dollar.
Conclusion
The USDSGD pair trades within the 1.36386 resistance and 1.36154 support. Although the bearish sentiment appears to be overwhelming, a recent break above 1.36246 resistance may be the breakout into new highs.
It’s safe to trade at the break out of the major resistance and support levels, with proper risk and money management, of course.
I've been a professional trader for over 5 years.
Currently I work as forex analyst for different investment companies.
- EURUSDWeekly outlook – 7th January 2022 - January 7, 2022
- BTCUSD – Weekly outlook for Bitcoin Price – 23rd December 2021 - December 24, 2021
- USDSGDWeekly outlook for Singapore Dollar – 17th Dec 2021 - December 17, 2021