
USDSGD Technical Analysis for Singapore binary options
Contents
Introduction
All through 2018, the SGD30 has been in a downward spiral bringing it to a17.5% price decline as it drags the Singapore dollar along with it. Read on as we look into the previous technical and recent fundamental events driving the price of the USDSGD for a Singapore binary options trade.
Singapore 30 [SG30SGD]

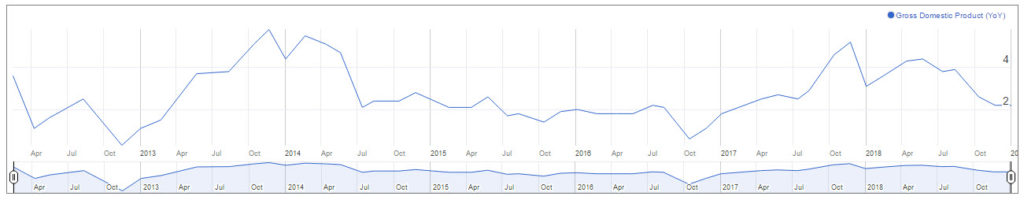
Gross Domestic Product (YoY) & (QoQ) 02 January 2019
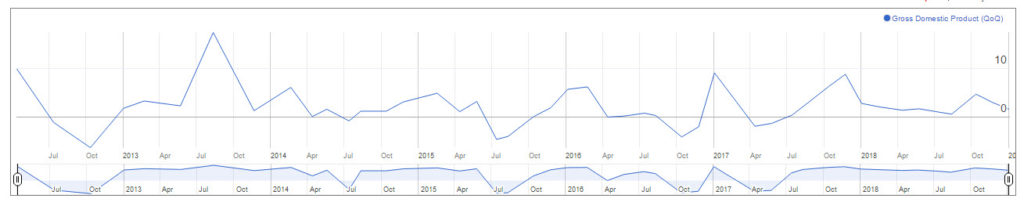
Singapore Department of Statistics released the nations GDP, which is a summary of the value of goods and services generated in the nation and helps in measuring the size of its economy.
The value of the GDP for both YoY and QoQ came out negative, resulting in a 0.35% correction of the USDSGD.
The U.S Dollar Currency Index [DXY]
After a Bullish regular divergence pattern triggered in combination with a triple bullish accumulation pattern 26 February to 19 March ’18, the price of the USD INDEX climbed by about 8.27% within 35 weeks, an opposite bearish regular divergence is triggered in combination with a bearish accumulation pattern. This indicates a long-term weakness of the US dollar as we enter into the New Year 2019. The above bearish divergence pattern is significant for the direction of major foreign exchange currencies paired against the U.S dollar.
Technical
USDSGD: Monthly Chart
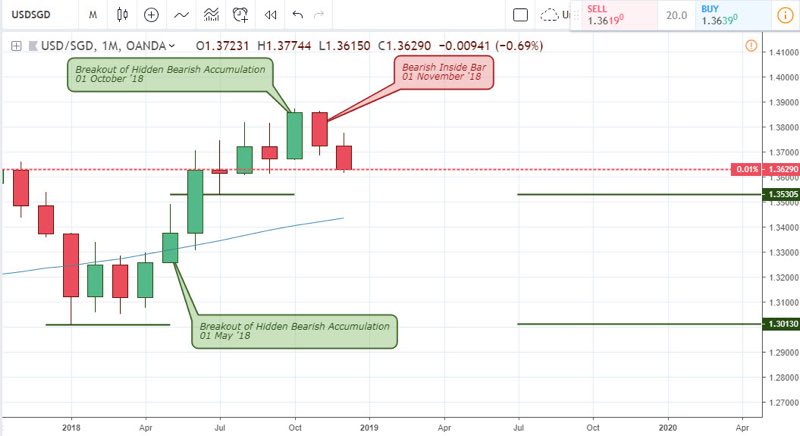
The month of December closed bearish below November’s bearish inside bar pattern. This may be the beginning of a series of bearish closing bars going forward into the New Year 2019.
USDSGD: Weekly Chart
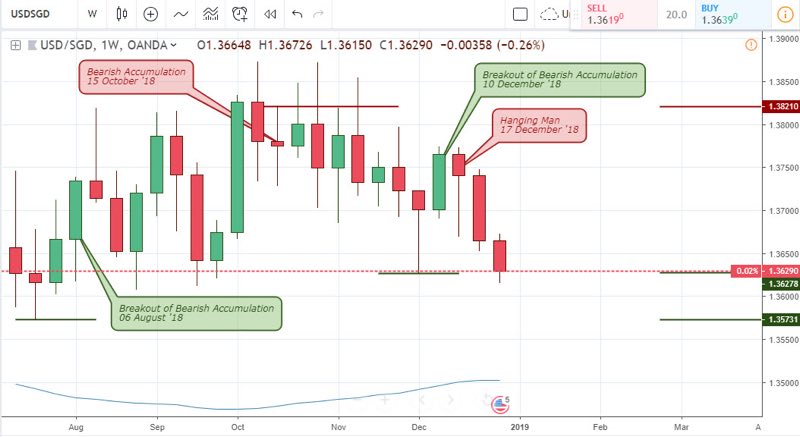
A breakout of bearish accumulation on August 6, 2018, established a support level at 1.35731, as the USDSGD struggled to climb by a mere 1.45% in 13 weeks. The resistance level of 1.38210 setups by the bearish accumulation pattern showed a strengthening of the Singapore dollar as the pair retraces the gains of the US dollar.
The support level of 1.36278 from the breakout of bearish accumulation is being tested again, after a hanging man candle pattern is signaled on December 17, 2018.
USDSGD: Daily Timeframe
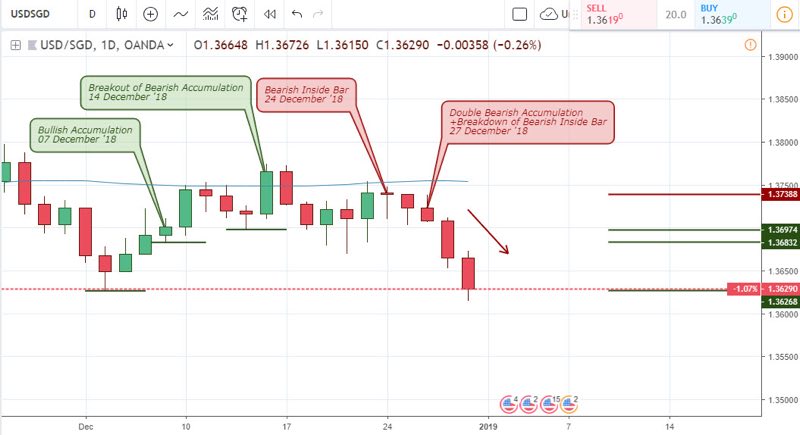
The breakout of bearish accumulation on December ’18 established a support level at 1.36974. This level could not stand the test of time as it failed to a formation of double bearish accumulation patterns formed on December 27 ’18.
4-HR Chart of the USDSGD
The breakout of bearish accumulation on December ’18 established a support level at 1.36974. This level could not stand the test of time as it failed to a formation of double bearish accumulation patterns formed on December 27 ’18.
4-HR Chart of the USDSGD
The 2hour chart supports the bearish trend direction of the 4hr chart from a breakdown of hidden bullish accumulation on the same December 27 ’18. On the last day of the year December 31, 2018, a bearish accumulation pattern signaled a short selling opportunity for OlympTrade investors which sends the pair down south.
Conclusion
The release of the US manufacturers PMI resulted in an increase in volatility across major currencies, and the USDSGD was not left out. Only time will tell if the bullish rally from this fundamental indicator can stand the test of time.
The USD Index, on the other hand, lends a clearer picture of the long-term direction of the U.S dollar. We’ll be looking out for a breakdown of bullish accumulation patterns on the USDSGD chart that supports this notion.

I've been a professional trader for over 5 years.
Currently I work as forex analyst for different investment companies.
- EURUSDWeekly outlook – 7th January 2022 - January 7, 2022
- BTCUSD – Weekly outlook for Bitcoin Price – 23rd December 2021 - December 24, 2021
- USDSGDWeekly outlook for Singapore Dollar – 17th Dec 2021 - December 17, 2021
Tagged with: usdsgd