
Bitcoin to USD weekly outlook for bitcoin Brokers
Contents
Introduction
Starting from the first day of the week, the exchange rate of the BTCUSD resumed a bearish trend after an initial bull run! Fundamental announcements are not all great for the crypto giant.
Fundamentals
Regulatory Adoption
Yesterday 24th September, a report from CNBC noted that Washington lawmakers will be meeting with representatives from both U.S based financial giants and startups in the cryptocurrency space. This roundtable discussion was hosted by Rep. Warren Davidson (R-Ohio). Invitee representatives include Nasdaq, Andreessen Horowitz, U.S Chamber of Commerce, as well as a crypto broker (Coinbase), and startup (Ripple), to mention a few.
Blockchain Adoption
Three bills were to be proposed by Rep Emmer a U.S lawmaker on 21st September, which is focused on supporting blockchain and digital currencies, as a way of developing blockchain technology. It is also intended to provide a safe harbour for taxpayers with forked crypto assets.
Also in the news is IBM, winning a patent for autonomous self-servicing of network devices, forming a part of its Autonomous Decentralized P-to-P Telemetry [ADEPT].
Speculative Adoption
Gemini, a crypto broker/exchange owned by the Winklevoss twins of Facebook fame, is eyeing entrance into UK markets, as told by sources to the Financial Times yesterday 24th September. This move may ignite more interest in the area of speculative adoption.
Technical Analysis
BTCUSD: Monthly Chart

Huge bearish pressure continues to prevail on the monthly time frame as the BTC to USD exchange rate is set up in a descending triangle pattern. This is huge bearish sentiment, owing to the fact that the move is accompanied by a double bearish accumulation pattern on 1st of March, similar to that which was formed last year 1st July.
An interesting level is a bearish support formed at $6115.00 by the bearish accumulation pattern. A price close below this level at this scale should send the price tumbling down towards $4000.00 region.
BTCUSD: Weekly Chart
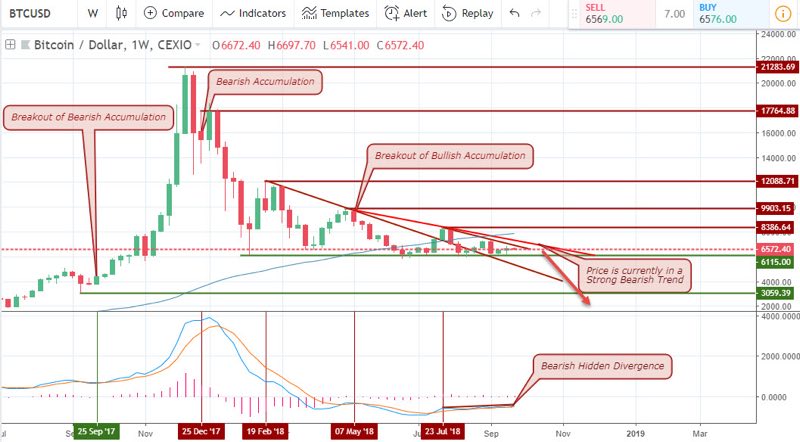
A variant of the monthly chart pattern is the weekly chart, which offers another perspective to the pair. It’s obvious from this point that the BTCUSD is in a bearish trend, as it makes consecutive lower highs, starting from the bearish accumulation pattern on 25 Dec. 17, 19 Feb 18, 07 May 18, 23 July 18.
If you recall from one of our previous posts, we made reference to a Chuvashov’s fork chart pattern formed by two trend lines. We were a bit optimistic back then that the pair will make a recovery in favour of the BTC. However, moving forward, it now becomes clearer that the bears are holding their grounds.
Silently placed in all of this is the bearish hidden divergence pattern recently formed. It’s quite a quiet one and could go unnoticed, but we’ve got it on our radar, and we are convinced of a short position on this time frame. Also, notice how price trades below the 65-period moving average and the MACD zero level.
BTCUSD: Daily Chart
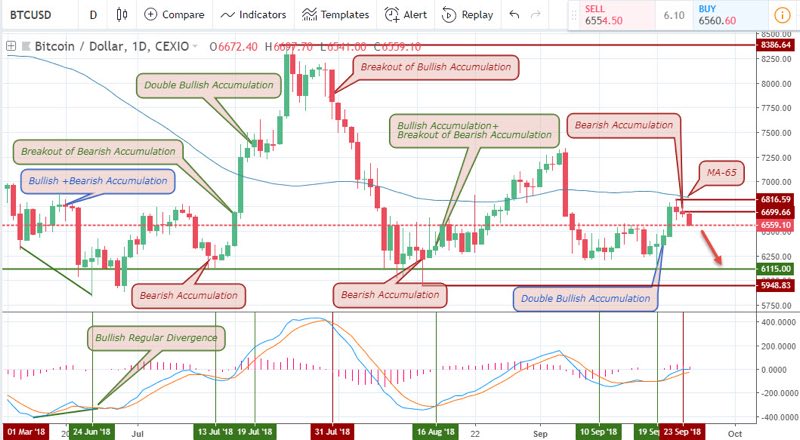
The daily chart offers more swing trading opportunities starting with a bullish regular divergence pattern on 24 Jun’18, followed by a breakout of a bearish accumulation pattern on 13 Jul ’18. A bearish swing was triggered on 31 Jul ’18, and even though the pair began to show signs of bullish rise on 16 Aug ’18 and 10 Sept ’18, we can clearly see that the bulls are beginning to lose steam, as the pair triggers a more recent bearish accumulation pattern after price comes really close to the 65-period moving average from below.
BTCUSD: 4-hour Chart
Here on the 4-hour time frame, we decided to streamline our view to flow between 9th September and the 24th September window frame. The double support levels created on the 9th and 12th of September by a breakout of a bearish accumulation pattern indicated how strong that level is. The same support level of 6229.81 and 6200.04 which both trades above the 6115.00monthly support level offer great buying opportunities.
BTCUSD: 2-hour Chart
Interesting enough, the 2-hourly chart appears to be in a bullish trend as it breaks out of bearish accumulation setups on both 18th Sept ’18 06:00 and 19th September ’18, moving on till 22nd September where it triggered an opposite break down of a bullish accumulation pattern on both 22nd September and 23 September. Currently, at the point of putting this article together, price, upon impact with the 65-period moving average triggers a double bullish accumulation pattern with short-term long-buying trading opportunity.
Conclusion and Projection
After looking at a broader time horizon and a lower window, we come to a conclusion that this week is more likely to go short as most of the time frame directions point south couple with a fact that the fundamentals also have more of negative sentiments towards the BTC.
On the other hand, if you are looking for a crypto broker to short the BTCUSD, you can take a look at our recommended bitcoin brokers section.
Our Recommended Cryptocurrencies Brokers to trade BTC to USD
Best Regulated Broker: IQ Option

IQ Option is the world’s leading EU regulated financial broker based with a revolutionary platform for all traders. Very popular for crypto trading. Read IQ Option review
- Best Trading App for Binary Options
- Minimum Deposit of only $10
- Minimum Trade of $1
- Trusted Broker
- $1,000 Virtual Funds ( Demo Account )
- Quick Withdrawals
- Outstanding Platform
- Weekly Tournaments
- Gain up to 92%*
Best Binary Options Broker: Olymp Trade

Olymp Trade is an award winning binary options broker with an excellent trading platform support and education tools. Read Olymp Trade Review
- Risk-Free Trades
- Minimum Deposit of only $10
- Max. 90% Payout
- $10,000 Free Demo account
- Free TrainingEducation : 18 Indicators, 7 strategies and 28 webinars 25% Deposit s
- Certified Platform
- Quick withdrawals
Best Binary Bonus: Binomo

Binomo is a regulated binary broker with a wide range of assets to trade and amazing promotions ( bonus, tournaments prizes,..) .Read Binomo Review
- 25% Deposit Bonus ( 100% Bonus VIP accounts )
- Minimum Deposit of only $10
- Minimum Trade of $1
- Max. 95% Payout
- $1,000 Virtual Funds ( Demo Account )
- Weekend trading
- Free training
DISCLAIMER

I've been a professional trader for over 5 years.
Currently I work as forex analyst for different investment companies.
- EURUSDWeekly outlook – 7th January 2022 - January 7, 2022
- BTCUSD – Weekly outlook for Bitcoin Price – 23rd December 2021 - December 24, 2021
- USDSGDWeekly outlook for Singapore Dollar – 17th Dec 2021 - December 17, 2021