
Today we are going to take a look a rather complex 60-second binary options strategy that uses a custom MT4 indicator called empty trend strength strategy.
Setting Up the Chart for Empty Trend Strength Strategy
Contents
For this strategy, you need to apply two MT4 indicators; the built in Fractals indicator and a custom indicator from Kjell Hasthi called the Trend Strength.
Basically, the Fractals would be showing support and resistance levels on the chart and the Trend Strength indicator will measure trend strength by calculating Bollinger Band with bars = 11 and deviation = 1, and EMA 3.
You need to download the Trend Strength MT4 indicator from here, and open your Data folder from the MT4 file menu, copy and paste it from your download folder into the > MQL4 > Indicators folder.
Then, restart your MT4 software, open a new chart (blank chart, please) and add these two indicators: Fractals and the Trend Strength indicator.
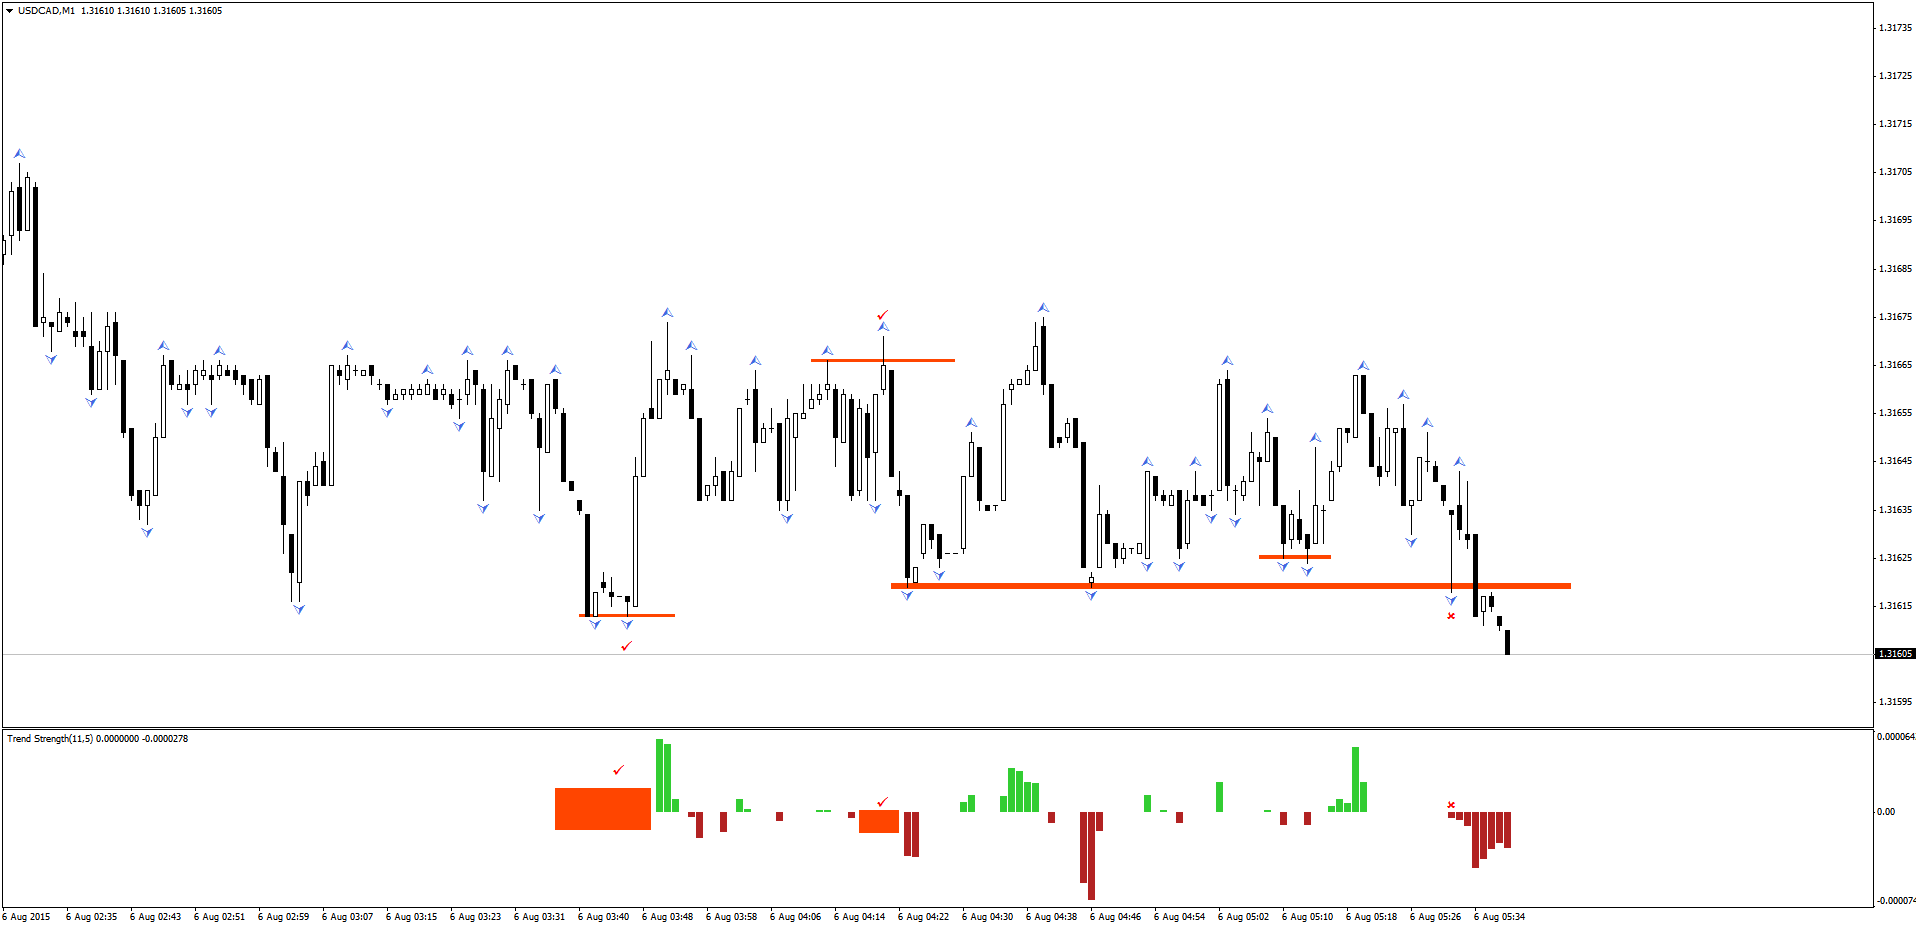
Besides the arrows, cross and Orange colored highlights we have put on the chart, your chart should look like the following:
How to Trade the Empty Trend Strength Strategy
If you have followed the steps, it may appear complicated so far. However, this strategy is actually very easy to follow.
Once you have set up the chart, you need to draw a horizontal line near the last up and down Fractals (the blue arrows), like we did.
Now, he reason this strategy is called “empty trend strength” is because we only place our orders when there is no strong trend in the market.
The Trend Strength indicator will show blank (empty) bars, which means no Green or Red bars, during a range bound market condition.
Rules for Placing CALL Order:
The first trade we took on the chart above was a CALL order. The reason was simple, the USD/CAD price formed a down fractal, price came back near to this support level and the Trend Strength indicator was showing blank bars (highlighted in the bottom in Orange). It meant, there were few sellers left and the price is likely to go up from here. So we placed a CALL order as close to the support zone and you can see the result. The USD/CAD price did not even penetrate below the support level.
Rules for Placing PUT Order:
The second trade we took was a PUT order. When the USD/CAD price came back to the resistance near the Up fractal, and the Trend Strength indicator was showing empty bars (again, highlighted in orange at the bottom), the price could not close above the resistance level.
In both trades, our 60-second strike price would be the support or resistance price.
The last trade we were considering to take was a CALL order. However, when the bar closed, the Trend Strength indicator produced a Red bar, which signaled that the price is likely to start trending downwards. Hence, we did not place any CALL order.
&n
Tagged with: Binary Options Strategy • Empty Trend Strength