
BTCUSD Technical Analysis for Bitcoin Broker
Contents
Introduction
The University of California in collaboration with the DFINITY Foundation recently reported in their research that a part of the addresses of the top three cryptocurrencies is vulnerable. This was followed by short selling in the cryptocurrency market, despite mentioning in the paper that it can be checked by current implementation in default bitcoin libraries.
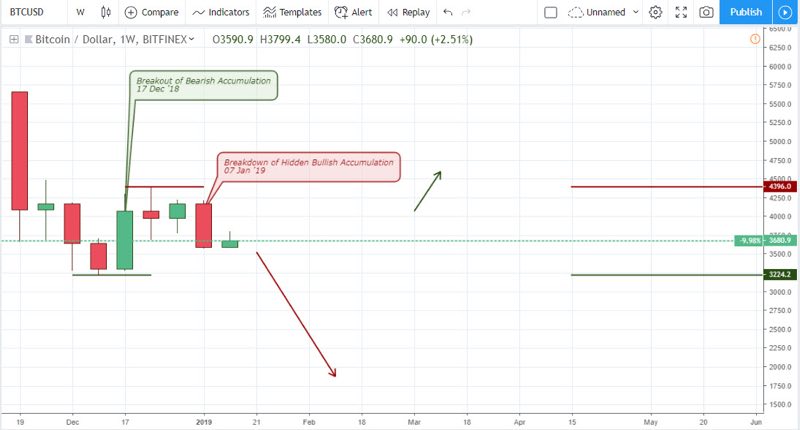
BTCUSD: Weekly Chart

From a previous analysis of the weekly chart, we anticipated a breakdown of the hidden bullish accumulation. Well the above chart confirms that as Bitcoin price breaks through the 3771.0 support. Last week 14 Jan ’19 also closed bearish triggering a bearish accumulation, thereby indicating selling pressure.
Bitcoin Fundamentals
Upcoming Events
From the above daily chart, the BTCUSD triggered a double bearish accumulation pattern on January 9 ’19, resulting in a 12.53% price decline. Prior to publishing this article, the BTCUSD still hovered above the bullish accumulation support at 3608.5. However, at the moment we see a bearish close below the accumulation support, thereby indicating a bearish week.
Bitcoin: This Weeks’ Upcoming Events
Bitcoin (BTC) Unconfiscatable Conference and Bakkt Launch
24 January 2019
Coming up next week is the Tone Vays’ Unconfiscatable Bitcoin and not Blockchain conference. This event will be taking place at The D Hotel, Las Vegas.
Another significant event coming up on the same date as the Unconfiscatable conference is the launch of Bakkt exchange given an increasing interest.
Bitcoin (BTC) CME: January Last Trade 25 January 2019
This year January, 25 is the last trade date of Bitcoin futures contract, with trading terminating at 4 PM GMT. This is an important event as it can give clues on the direction of Bitcoin trend in the coming month. Already, the month of December 2018 closed, triggering bearish accumulation pattern. Similar pattern build up is in view, and we may see a further increase in selling pressure should that be the case.
Technical Analysis
BTC/USD: 4-HR Chart
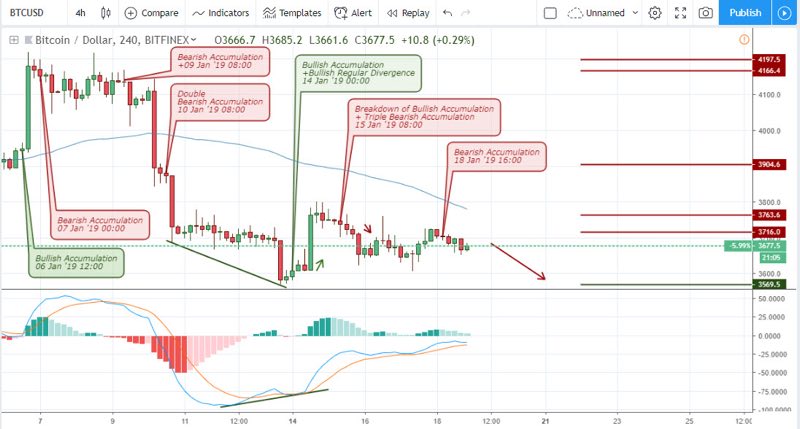
The 4-hour chart triggered a bearish accumulation pattern on Jan 7 ’19 00:00 to counter the bullish move from a bullish accumulation on Jan 6, ’19 12:00. The BTCUSD pair from that point plummets by approximately 14.0%.
An opposite signal in the form of a bullish regular divergence was triggered on Jan 14 ’19 00:00 in combination with a bullish accumulation pattern on the same date. The Bitcoin price soared by 5.23% before plunging to a failure of bullish accumulation in succession with triple bearish accumulation on Jan 15 ’19 08:00.
BTC/USD: 4-HR Chart UPDATE
The triggered failure of bullish accumulation could not stand the test of time as price closed above the newly established resistance, resulting to a loss. This is why trading on lower time frames results in a few losing trades as sudden volatility may trigger exit points.
As shown above, the pair now initiates regular bullish divergence on 14 January ’19 and 21 January ’19. A failure of the current bullish accumulation on 22 Jan ’19 will trigger a continuation of the short sells.
Conclusion and Projection
Going forward, we expect further price decline of the BTCUSD and a target zone around 2458.97 and 1826.2. Shopping for a bitcoin broker, such as IQ Option Singapore? Visit the broker section of our website for a list of hand vetted brokers to execute your trades.

I've been a professional trader for over 5 years.
Currently I work as forex analyst for different investment companies.
- EURUSDWeekly outlook – 7th January 2022 - January 7, 2022
- BTCUSD – Weekly outlook for Bitcoin Price – 23rd December 2021 - December 24, 2021
- USDSGDWeekly outlook for Singapore Dollar – 17th Dec 2021 - December 17, 2021
Tagged with: btcusd