
BTCUSD Technical Analysis for Cryptocurrency Market
Contents
Introduction
The rush for cryptocurrencies in 2017 could not stand the test of time entering the year 2018 following problems of scaling and unmet expectation of institutional investment based on forecasts by experts.
Most cryptocurrencies completed 2018 with a sharp price slump, and no immediate sign of a price recovery. Bitcoin, on the other hand, hovers around the $4k range and speculators show signs of a possible come back.
Read on as we throw more light on the technical and fundamental events in this BTCUSD analysis.
BTCUSD: Weekly Chart

Following a 50% plunge in the price of Bitcoin from a triggered bearish accumulation pattern on November 5 ’18, the latter part of the year 2018 hinted a bullish recovery by signaling a bullish engulfing candle pattern.
The bullish close of last week’s candle of December 31 ’18 triggered a hidden bullish accumulation pattern, confirming a bullish sentiment towards the Bitcoin price. A break below the accumulation support 3782.57 should signal a continuation of the bearish trend.
Not forgetting the formation of a bearish accumulation pattern that established a strong resistance level at 4282.85. A violation of this level will strength buying confidence to the upside.
Bitcoin Fundamentals: Physical Bitcoin Futures by Coinfloor Crypto Exchange
On January 7, in an interview with Bloomberg, the CEO of CoinfloorEX, a section of Coinfloor, a UK cryptocurrency exchange, has been restructured on the Asian market enabling traders to physically swap Bitcoin futures.
Upcoming Events
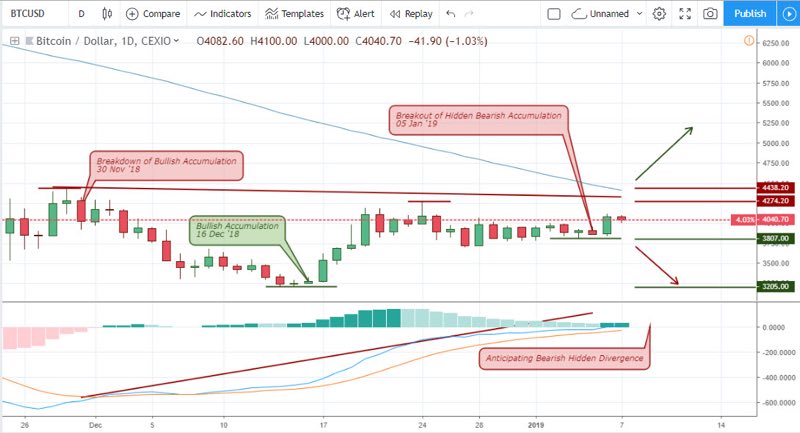
Bitcoin, a pacesetter in the cryptocurrency market would often trigger signals that dictate the market direction. Taking a look at the above daily chart, a bullish accumulation pattern on December 16 ’18 was the trigger for a 30.2% rise. Price so far has not been able to close above the 4438.20 resistance level. A dead cross of the MACD oscillator before price hits the above-mentioned resistance level will trigger a bearish hidden divergence pattern. This will launch a follow-up of the bearish trend.
Bitcoin (BTC) Cboe XBT Expiration Date 16 January 2019
Speculators and IQ Option traders are paying close attention to this event, which is the expiration date of the Bitcoin Future Contract (XBT/F9). This event should bring high volatility into the markets.
BTCUSD: 4-HR Chart
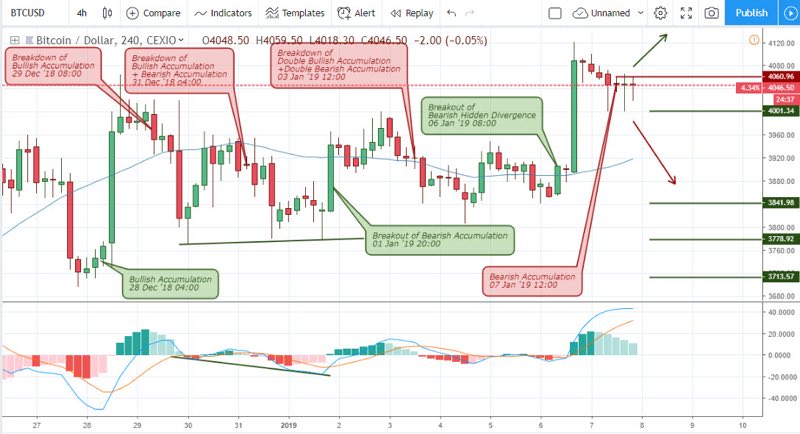
On different Bitcoin brokers the 4hour chart enters into an up and down rollercoaster, as it starts with a bullish accumulation pattern on December 28 ‘18. The Bitcoin price from this point made an 8.5% increase, followed by a breakdown of bullish accumulation on December 29 ’18.
A breakout of hidden bearish accumulation January 6 ’19 08:00 initiated a 6.0% price increase. On January 7 ’19, price triggers a bearish accumulation pattern. A bullish breakout above the 4060.96 level will trigger a continuation of the move, otherwise, the bearish decline could persist.
Conclusion and Projection
Looking at the level where Bitcoin is, and the technical patterns triggered on the weekly time frame, a further gain in price shouldn’t be a surprise. On the other hand, we should be mindful of the resistance level at 4282.85 established by the monthly chart. The upcoming fundamental events may be sufficient for a break of this level. Let’s not also forget to look out for reversal patterns in the form of breakdown of bullish accumulation on the BTCUSD daily chart.

I've been a professional trader for over 5 years.
Currently I work as forex analyst for different investment companies.
- EURUSDWeekly outlook – 7th January 2022 - January 7, 2022
- BTCUSD – Weekly outlook for Bitcoin Price – 23rd December 2021 - December 24, 2021
- USDSGDWeekly outlook for Singapore Dollar – 17th Dec 2021 - December 17, 2021