
BTC/USD Outlook & Technical Analysis for Bitcoin platforms
Contents
Introduction
Bitcoin BTC price breaks out of July 22 bearish weekly inside bar and is set for a continuation of the bullish trend. A recent increase in selling pressure on short time frames shows that the bears are not willing to make the upbeat campaign an easy one.
Come along as we probe deeper into interesting news and the technical chart patterns driving the BTC price on IQ Option platform..
Bitcoin: In the news
Tim Draper has predicted that the price of Bitcoin (BTC) will hit the $250,000 target by Q12023.
In an interview with Yahoo! Finance on August 09, Draper revealed that Bitcoin’s standing as a refuge asset might see investors wait an extended period longer than planned to experience the price hitting $250,000. Citing current trends, he admitted that there might be a slight delay to the giant price tag becoming a reality.
Draper also revealed that though people have consolidated towards Bitcoin more than he thought due to its decentralized network, he had expected many more competitors that were relevant at this point.
BTC/USD Technical Analysis
BTCUSD: Monthly Chart

Following a top-down approach from a monthly time frame, the Bitcoin price managed to close bullish throughout the second quarter of 2019, followed by a bearish inside-bar price pattern on the first month of Q3 ’19.
Though last month closed bearish, the pair is still strongly bullish, and a break above the 13200.00 resistance will confirm the price rally. On the other hand, a breach of the $9049.54 support may suggest bearish sentiment.
BTCUSD: Weekly Chart

Above is the weekly time frame illustration of the breakout ($10686.89) highlighted in the introduction. The move was signaled in combination with a hidden bullish divergence pattern following a price retracement that lasts for five weeks.
BTCUSD: Daily Chart

After the 4.94% price decline, the bulls found support at $11080.37 and are not ready to give in to further reduction of the Bitcoin to dollar exchange rate. Further bullish close of the BTC on the daily time frame may suggest a continuation of the bullish trend as the price sits on the $11,120.00 support of July 20 ’19.
BTCUSD: H4 Chart
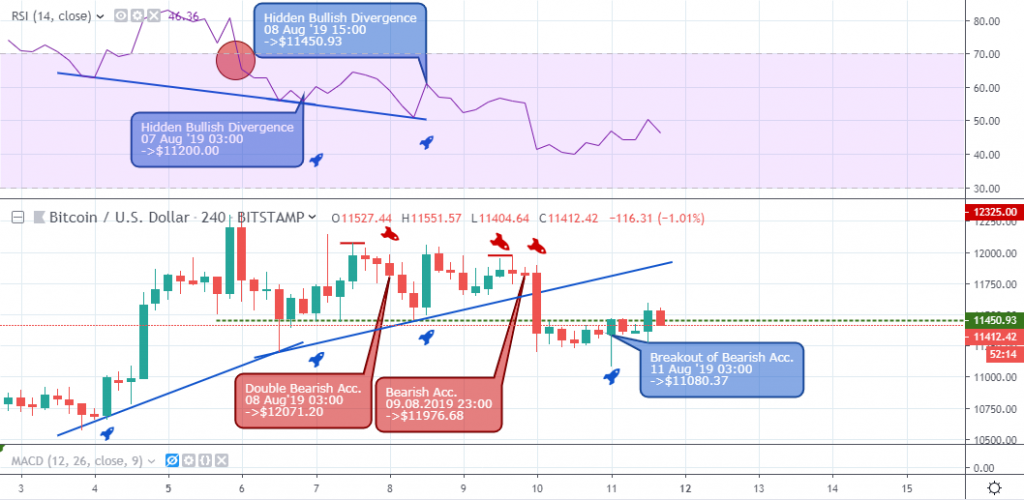
Coming down to the 4hour time frame, we observed a weak bullish trend from the successive lower highs on August 08 and 09, before the transition from an accumulation of bulls to bears at the twenty-third hour of August 09.
The bullish divergence trend line collapsed to selling pressure on August 10 ’19, however, not long after that, the bulls again breached a resistance level at $11,366.74 showing they’re not entirely out.
BTCUSD: H2 Chart
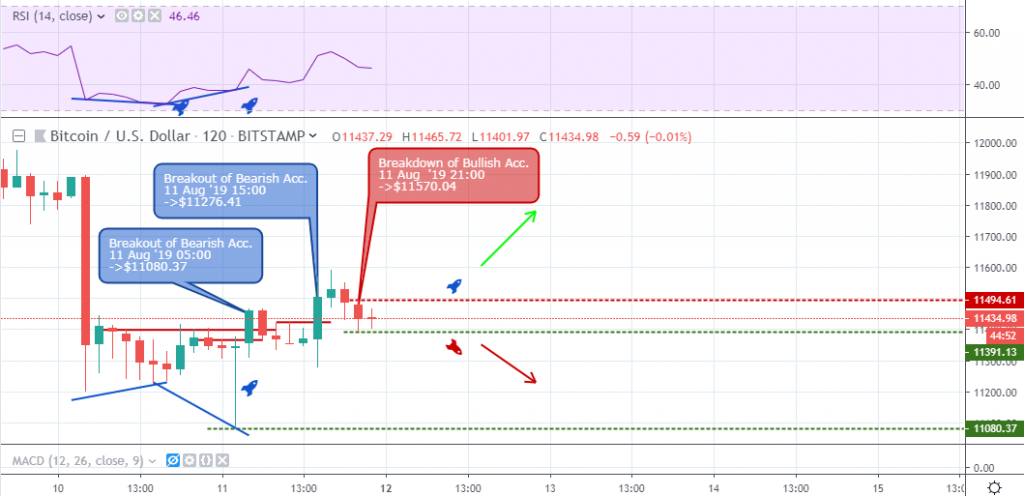
From an intraday level, the BTC/USD on top Singapore broker platforms rebounds from the initial price plunge via a sequence of bullish divergence patterns on August 10 19:00 and 11 05:00.
Not long after the rebound, the BTC price again breaks below bullish support ($11468.49) to resume a bearish descent.
Conclusion and Projection
In the long term, the Bitcoin price maintains a bullish outlook, as we project a series of bullish closing bars on the weekly time frame.
It’s going to be quite a rollercoaster to the top as we expect the last quarters high $13880.0 to serve as resistance while traders take the profit off of the $14000.00 round number.

I've been a professional trader for over 5 years.
Currently I work as forex analyst for different investment companies.
- EURUSDWeekly outlook – 7th January 2022 - January 7, 2022
- BTCUSD – Weekly outlook for Bitcoin Price – 23rd December 2021 - December 24, 2021
- USDSGDWeekly outlook for Singapore Dollar – 17th Dec 2021 - December 17, 2021
Tagged with: btcusd