
BTCUSD Outlook & Technical Analysis for Binary Options
Contents
Introduction
The Bitcoin network is becoming more efficient and scalable with the Lightning network solution. According to reports from Circle Research, the Bitcoin network has seen about 100% increase in open channels. A scalable network along with an increase in institutional investment, according to JP Morgan Chase has contributed to a general rise in the Bitcoin price on crypto brokers.
This week we’ll be taking a dip into important news and technical drivers of the Bitcoin price. Come along.
Bitcoin Fundamentals
Bitcoin: In the news
Argo Blockchain: A 24% surge in profit from Bitcoin Mining
In a report issued by Argo Blockchain a UK based BTC mining operator on 02 July, the company stated an approximate 101% increase in mining results compared to that of May and depicting an 81% mining margin.
The steadily growing Bitcoin BTC price contributes to an increase in returns from existing and operational mining hardware.
According to a press release on 03 July ’19, Coinsquare, a Canadian exchange has procured software that will allow traditional ATMs to sell Bitcoin and other cryptocurrencies.
Coinsquare has a controlling share in Just Cash, a US-based Fintech startup; built the software that allows users to purchase cryptocurrencies without the need for a mobile App or traditional hardware.
BTCUSD Technical
BTCUSD: Daily Chart

The increase in buying power on 17 June ’19 forced the Bitcoin price into overbought territory, and on to a monthly high of 13764.0 USD.
On 02 July, an increase in selling pressure drove the BTC price south, and threaten to close below the critical 10560.0 USD support that was established by an earlier cluster of buying power (24 June ’19).
The 17 June ’19 pivot point of 8985.9 USD triggered a hidden bullish divergence at press time, as the price could not get to the support level.
BTCUSD: H4 Chart

A view from the 4hour chart reveals a rejection of bullish support on 29 June ’19 23:00, following an increase in selling pressure.
The bearish move tripped of a couple of stop-loss orders by bulls bringing the price to a 17.0% low where a counter break of selling resistance was triggered.
Sellers again initiated a couple of sell orders which were bear traps and eventually restored the Bitcoin price to a high of 11584.0 at press time.
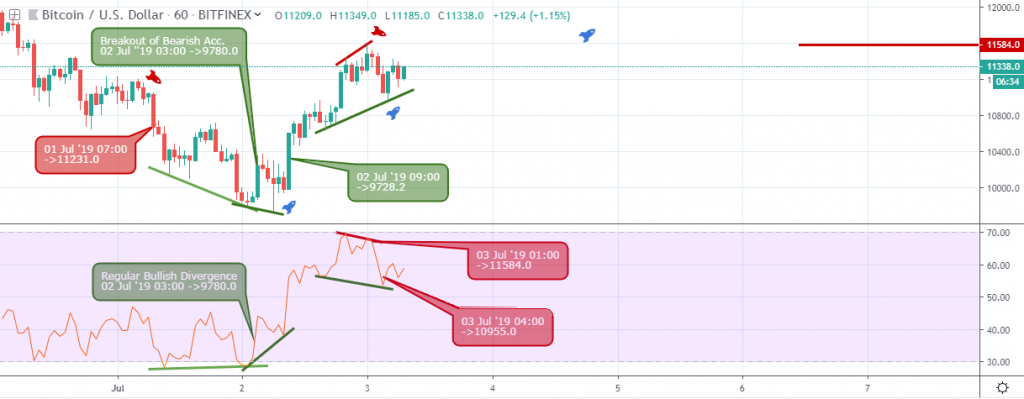
BTCUSD: H1 Chart

Zooming way down to the 1hour time frame, the BTCUSD flagged a break of selling resistance on 27 June ’19 17:00 (10388.0 USD), followed by a higher low at 10799.0 USD.
After an 11.3% price rally, the pair flagged a bull trap candlestick pattern that sent the price below the 10,000 USD round number support (21.5% decline).
We’ll look into that at the conclusion section of this post.
Conclusion and Projection
The sudden and rapid price dip of 01 July ’19 sent panic across the crypto market as different technical support levels were breached. However, a regular bullish divergence pattern, signaled in combination with a breakout of selling resistance got the price racing back to the upside and consequently restoring the Bitcoin price at 11584.0 USD.
With an expanding channel formed by opposing bearish and bullish divergence setups, the price is set for another round of Impulse waves, a good time to buy bitcoin on Singapore broker platforms.

I've been a professional trader for over 5 years.
Currently I work as forex analyst for different investment companies.
- EURUSDWeekly outlook – 7th January 2022 - January 7, 2022
- BTCUSD – Weekly outlook for Bitcoin Price – 23rd December 2021 - December 24, 2021
- USDSGDWeekly outlook for Singapore Dollar – 17th Dec 2021 - December 17, 2021
Tagged with: btcusd