
BTCUSD Outlook & Technical Analysis
Contents
Introduction
At press time, a new monthly high of about 9490.0 USD was established on global Bitcoin brokers, as demand for the number one cryptocurrency increases following last weeks’ long bullish closing candle.
Let’s take a look at interesting events in the crypto space as well as technical price patterns driving the price of the BTC.
Bitcoin Fundamentals
Bitcoin: In the news
BTC Futures contract Beats All-time high
In an 18 June Twitter post, data released by the (CME) Chicago Mercantile Exchange shows the Bitcoin (BTC) open interest striking an all-time high
The CME showed that open interest for the Bitcoin futures attained an all-time high of 5,311 contracts, a total of about 26,555 BTC. The CME went on to say institutional investors are beginning to show more interest in Bitcoin futures.
BTCUSD Technical
BTC/USD: Daily Chart

After forming an expanding channel by a regular bearish and hidden bullish divergence pattern on 30 May and 06 June ’19, the Bitcoin price confirmed the hidden bullish divergence by signaling a bullish pressure candlestick setup on the same date setting support at 7455.0 USD.
The following bullish accumulation pattern on 13 June ’19 allowed for scaling into a bullish trend, this, of course, is after the RSI closed above the level-50.
BTCUSD: H4 Chart

A view from the 4hour time frame also reveals the pair enclosed within an expanding channel.
Notice the regular bearish divergence patterns on 30 May 11:00 and 09 June 15:00.
At the regular bearish divergence setup, the pair exits overbought area and later exits the oversold territory after a relative 13.0% price decline from the bearish divergence entry price.
The price retracement came to a halt after the earlier mentioned regular bullish divergence setup, and the bulls got ready to take the Bitcoin price for an upward price rally.
As the price advanced higher, a further break of bearish resistance on 10 and 11 June ’19 led to the price increase of 21% from the bullish divergence.
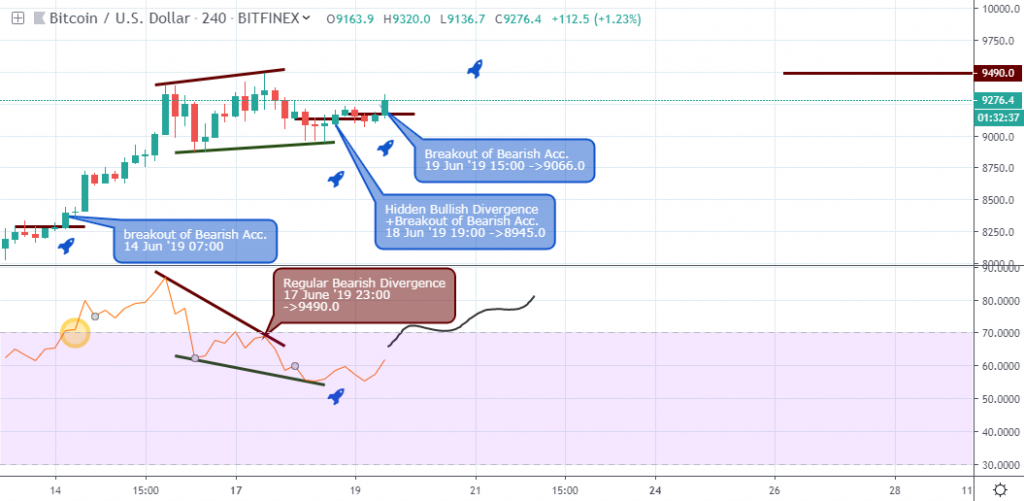
An update to the 4hour chart reveals more rejection of bearish resistance on 14 June ’19 07:00, as the price skyrockets into overbought territory and signaling more buying pressure on 11th hour of 14 June and 7th hour of 15 June.
Another expanding channel is confirmed by a hidden bullish divergence setup and break of bearish resistance on 18 June ’19 19:00 after an earlier regular bearish divergence on 17 June ’19 23:00 with set resistance at 9490.0 USD.
BTCUSD: H1 Chart

The 1hour intraday chart above illustrates bullish pressure forcing price past the bearish resistance levels on the 14, 13, 12, and 11th of June, with set support levels at 7923.0, 7711.0, 8249.8, and 8026.0 respectively.
By placing our first order on 11 June, and stop loss level fixed below the7679.7 USD support, the price surged into a bullish rally.
Upon entering a favorable area, the stop loss is moved below the next support level at 7887.8 USD.
This way, we protect our floating profits and deposits from unexpected price spikes.
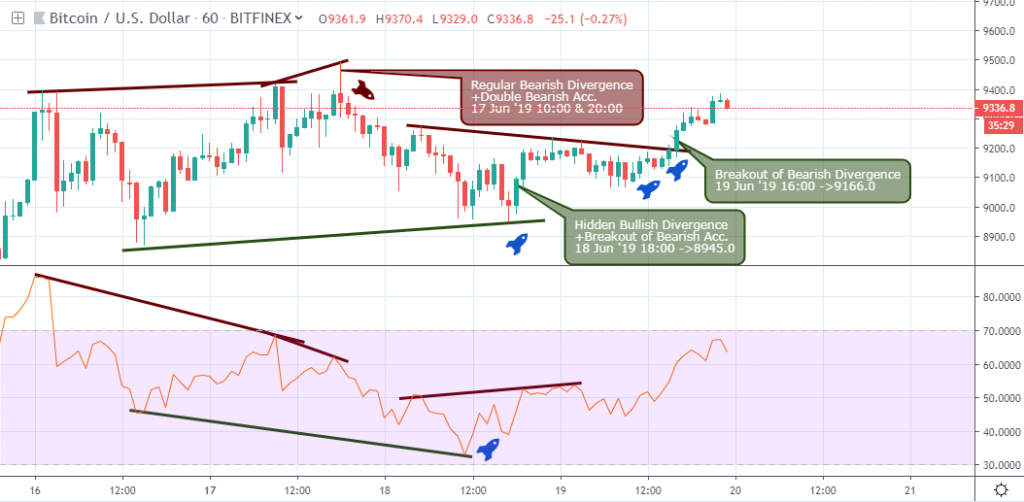
From the above chart, the stop loss was moved until the fifth flag. However, the price chart later signals regular bearish divergence on 17 June ’19 as shown on the updated chart below. Opportunities to scale in more entries were presented at subsequent breaks of bearish resistance.
Again, another expanding channel is placed formed by familiar bearish and bullish divergence pattern, with the bullish divergence always winning at the end of the day.
A break of bearish resistance was triggered as confirmation to a hidden bullish divergence pattern on 18 June ’19 18:00, which gave the early boost for a price break above bearish resistance on 19 June ’19 16:00. Support levels are established at 9166.0, and 8945.0.
Conclusion and Projection
With institutional and mainstream adoption on the rise, we look forward to further high for the BTC using technical chart patterns similar to the ones identified market timing on Singapore broker platforms.

I've been a professional trader for over 5 years.
Currently I work as forex analyst for different investment companies.
- EURUSDWeekly outlook – 7th January 2022 - January 7, 2022
- BTCUSD – Weekly outlook for Bitcoin Price – 23rd December 2021 - December 24, 2021
- USDSGDWeekly outlook for Singapore Dollar – 17th Dec 2021 - December 17, 2021
Tagged with: btcusd