
USDSGD Outlook and Technical Analysis for Singapore Brokers
Contents
Introduction
Last week on trading platforms of major Singapore binary options broker, an increase in demand for the Singapore dollar resulted in a 1.2% price growth, an indication of recovery of the economy.
Let’s look at the interpretation of the technical and fundamental indicators driving the exchange rate.
Singapore Fundamentals
Singapore Consumer Price Index
The Singapore CPI gauges the rate at which the price of goods and services for homes changes, within a specific period, as well as a measure of inflation looking at an average consumer’s capacity to acquire products and services.
After rising above level zero on 23 March ’18 with value at 0.5, the Singapore CPI has been in a bullish trend.
However, we observe an inverse correlation between the Singapore CPI and the USDSGD as the new value (0.9) on Monday 24 June was released higher than the previous (0.8).
United States Fundamentals
US Nondefense Capital Goods Orders excluding Aircraft
The macroeconomic indicator, as published by the United States Census Bureau, gauges the cost of orders held by producers of intense capital goods. Such capital goods include durable products for the production of goods and services, which is goods to withstand a period of 3years and above.
The actual reading came out at 0.1% higher than the previous reading released at -0.9%.
USDSGD Technical Analysis
USD/SGD Monthly Chart

As illustrated on the above monthly chart, the USD to SGD exchange rate started a bearish price decline on 01 November ’18, following a breakdown of an inside-bar pattern.
A sudden increase in buying pressure (approx. 1.70%) was signaled on 25 March ’19, after identifying a collection of buyers. The current price plunge experienced this month if maintained may confirm the bullish price close in May as a bull trap formation.
USDSGD: Weekly Chart

The above weekly time frame shows a rejection of selling pressure on 25 March ’19 setting reliable support at 1.34541. The combination of buying power on the Monthly time frame with this breakout pattern increased confidence to go long, which consequently led to a 2.0% increase in the foreign exchange of the USD to Singapore Dollar.
An opposing bearish dark cloud cover and supply signal was fired on 27 May ’19, resulting to a price decline of approximately 1.60%.
USDSGD H4 Chart

Did you notice the bullish closing price-bar on the weekly chart? Well, it was initialized by a regular bullish divergence setup on 09 June ’19 16:00 with set support at 1.36104, and last for a week before an opposing collapse of buying pressure was signaled on 17 June ’19 16:00 for a 1.30% slump.
USDSGD H1 Chart
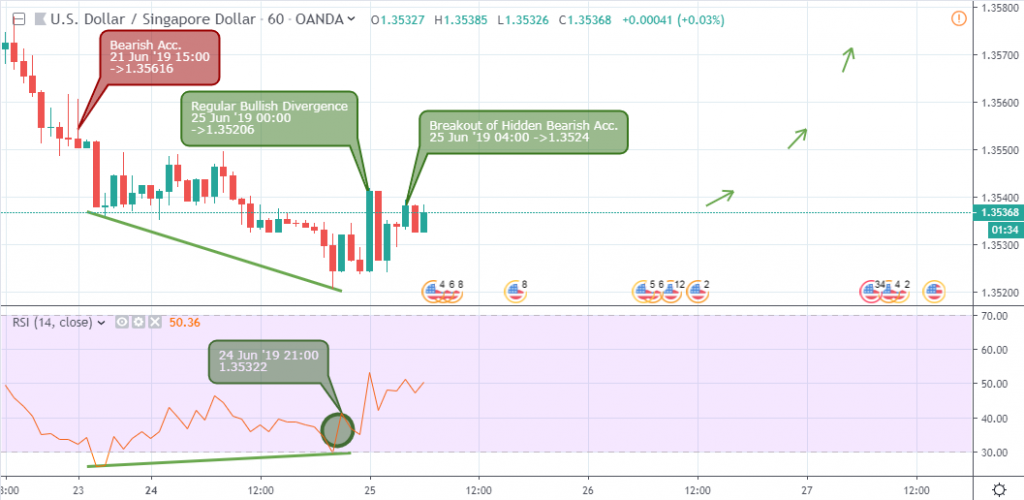
The intraday 1hour chart reveals a regular bullish divergence setup following an exit of oversold level on 25 June ’19 00:00 coinciding with a similar bullish divergence labeled on the 4hour overview.
Conclusion and Projection
The exchange rate of the USD to SGD at press time trades above the oversold region after a close above the RSI level-30 on 25 June ’19 08:00, and we should be on a lookout for further rejection of selling pressure on the lower 1hour and 4hour time frames as the bearish trend appears to be overextended

I've been a professional trader for over 5 years.
Currently I work as forex analyst for different investment companies.
- EURUSDWeekly outlook – 7th January 2022 - January 7, 2022
- BTCUSD – Weekly outlook for Bitcoin Price – 23rd December 2021 - December 24, 2021
- USDSGDWeekly outlook for Singapore Dollar – 17th Dec 2021 - December 17, 2021
Tagged with: usdsgd