
USD/SGD Outlook and Technical Analysis for Singapore brokers
Contents
Introduction
Hello traders! The exchange rate of the USD to SGD is ready to rally in the upward direction. Come on as we analyze the technical, fundamental indicators emphasizing the right timing by the bulls.
Singapore Fundamentals
Singapore 30 (SG30SGD): Monthly Chart
The current month retraces the upward price surge, and the price of the SG30SGD hovers above the bullish accumulation support, preparing for a probable price rebound in the up direction. Meanwhile, the current decline in the price of the SG30SGD reflects bearish sentiment for the Singapore dollar on IQOption Singapore platform.
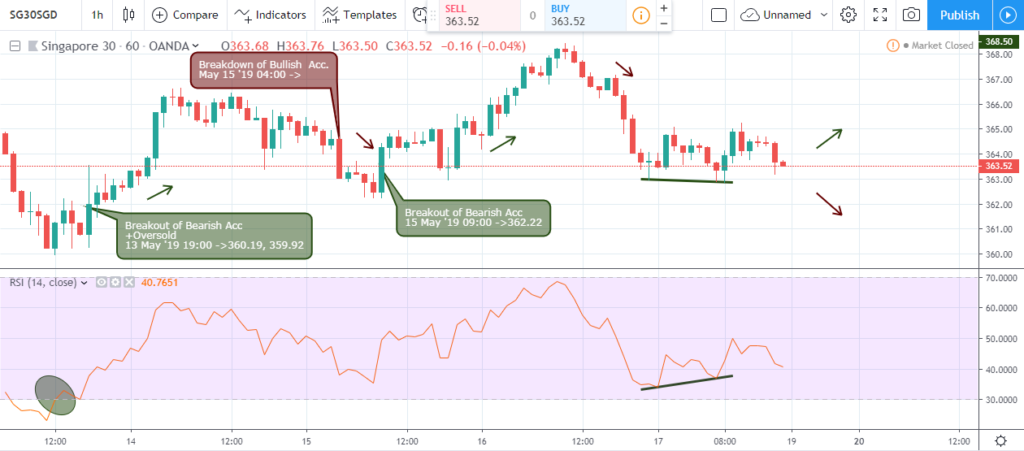
Singapore 30 (SG30SGD): 1HR Chart

A view from the monthly time frame of the Singapore30 shows the price of the SG30 coming out of oversold and confirmed by a breakout of selling resistance on May 13 ’19 19:00. The above chart reflects a range bound Singapore economy.
United States Fundamentals
Michigan Consumer Sentiment Index
The University of Michigan issued the Consumer Sentiment Index, which gauges the economic activities of consumers in the U.S.
This economic indicator paints a picture illustrating the willingness of consumers towards spending money.
A low value points towards a bearish stance for the USD, while a high value is considered bullish for the Greenback.
The previous reading was at 97.2, a 97.7 consensus and actual value to be released on May 17 at 14:00 GMT+2.
Technical Analysis
USDSGD Monthly Chart
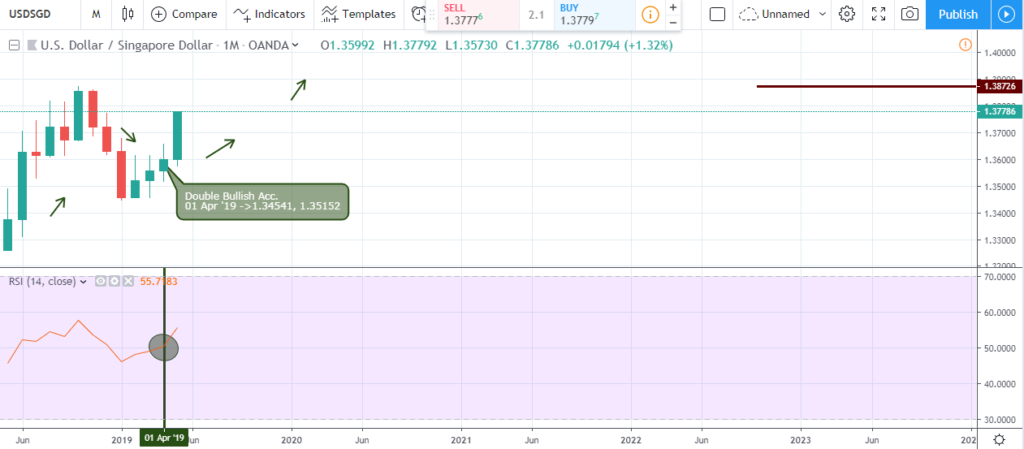
The long-anticipated double bullish accumulation setup is finally triggered following the close of April, setting strong support at 1.3451, and 1.35152 respectively.
A cross of the RSI level-50 from below further reinforce the bullish campaign as the exchange rate of USD to SGD already increased by 1.30%.
USDSGD Weekly Chart
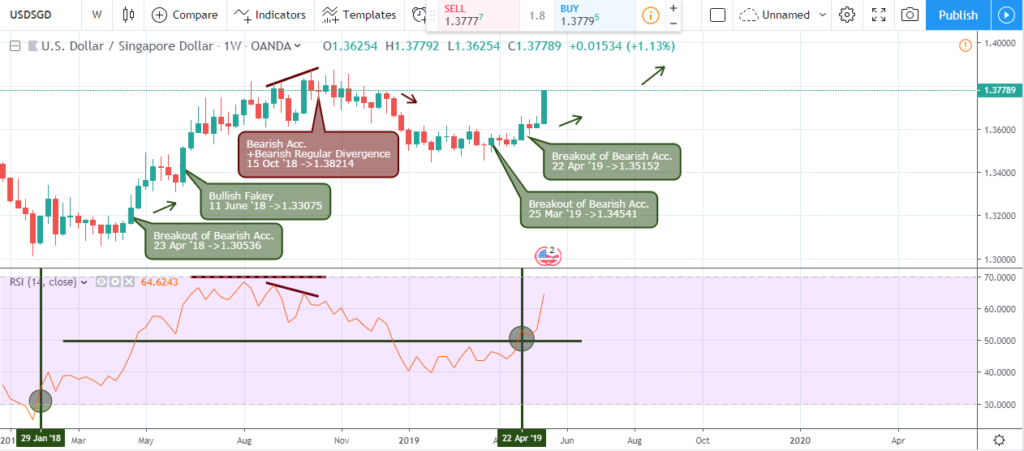
On January 29 ’18 the USDSGD broke out of oversold by crossing above the Level-30 of RSI.
The bullish campaign was reinforced by a close above the bearish pressure resistance on April 23 ’18, setting strong support at 1.30536. This was confirmed by a break above the RSI level-50 on the same date.
Selling pressure signaled on October 15 ’18 set up resistance at 1.38214 which was later countered by a rejection of selling pressure on March 25 ’19. The break above the level-50 of RSI and another break of selling resistance on April 22 ’19 further confirm the bullish campaign started on the monthly chart.
USDSGD Daily Chart
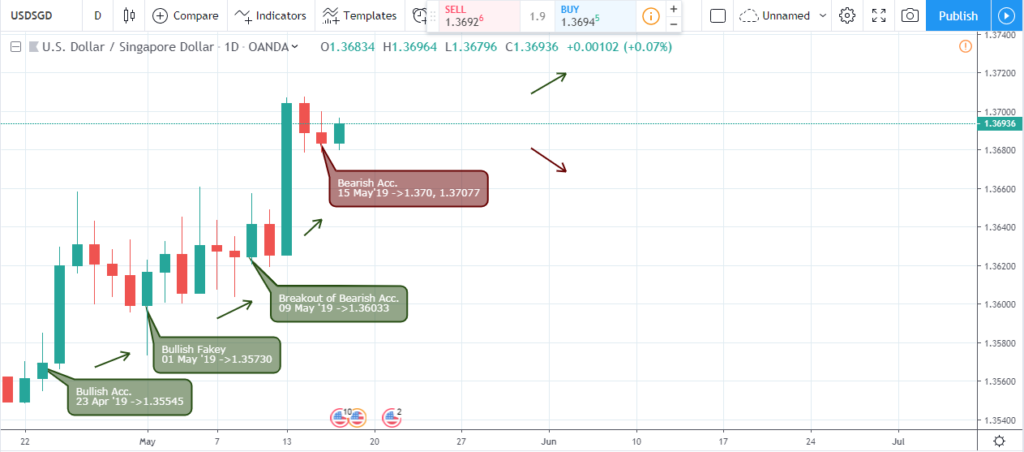
A view from the daily time frame also an increase in buying pressure starting on April 23 ’19 setting support at 1.35545, followed by a bullish Fakey pattern on May 01 2019 with strong support at 1.35730.
A collapse of selling pressure on May 09 led to a price surge of about 1.03% as the RS cross above the level-70 region.
USDSGD H4 Chart
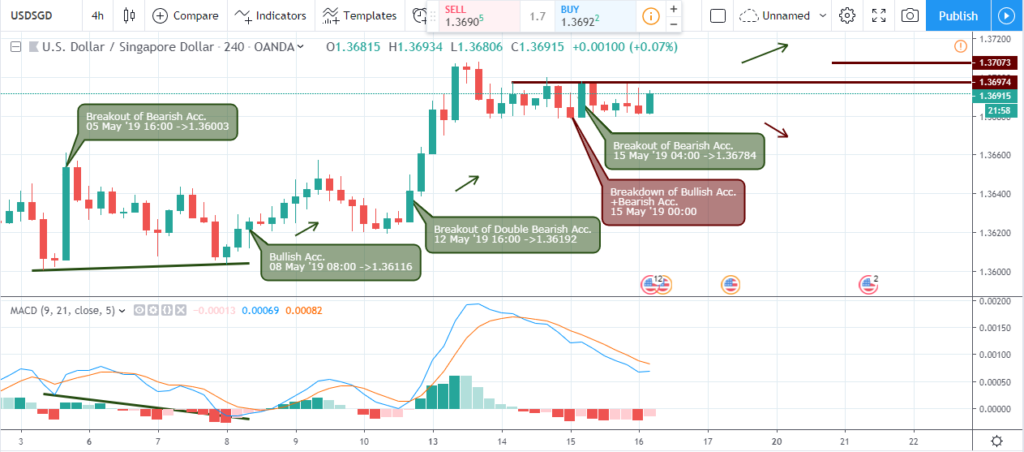
A view from the 4-hour time frame reveals an increase in buying pressure on May 05, 08, and 12 ’19.
The 4hour chart further reveals the pair trapped between the 1.36974 and 1.36784 resistance and support levels.
USDSGD: H1 Chart
Going way down to the 1hour intraday time frame, the pair signals a breakdown of buying pressure at the 13th and 18th hour on May 2019.
The pair gradually eased into a horizontal channel formed by a breakout of bearish accumulation on May 14 and a bearish pressure formation on May 15 2019.
Conclusion and Projection
At press time, the USDSGD pair already breaks above the daily selling pressure resistance levels, 4hour resistance and intraday horizontal channel.
We look forward to the foreign exchange of USDSGD getting to the previous 1.38726 high.

I've been a professional trader for over 5 years.
Currently I work as forex analyst for different investment companies.
- EURUSDWeekly outlook – 7th January 2022 - January 7, 2022
- BTCUSD – Weekly outlook for Bitcoin Price – 23rd December 2021 - December 24, 2021
- USDSGDWeekly outlook for Singapore Dollar – 17th Dec 2021 - December 17, 2021