
USDSGD Outlook and Technical Analysis for Singapore Dollar
Contents
Introduction
In the last three weeks and on IQ Option, a major forex platform, the Singapore Dollar showed strength against the USD following an intensified trade war between the US and China.
Join us, as we take a closer look at the technical and fundamental drivers of the USDSGD pair.
Singapore Fundamentals
Singapore 30 (SG30SGD): Daily Chart
After breaking out of a bearish resistance on 26 April ’19, the SG30SGD signaled a regular bearish divergence, sending the price tumbling down by approximately 7.40%.
A trend reversal pattern triggered from a break of bearish resistance was initialized on 04 June ’19 setting support at 347.15, as the RSI exits the oversold area. The current increase suggests the recovery of the Singapore economy.
United States Fundamentals
US Unemployment Claims
Growth in the value of unemployment claims shows a weak US economy and consequently, the USD.
To receive temporary payment, an individual may file a request to a state government after being laid off.
Following a decline from 230K to 212K in May, the unemployment claim is on the increase to 218K, though the consensus is viewed at 215K
USDSGD Technical Analysis
USDSGD Monthly Chart

Following a top-down analysis, and starting from the monthly time frame, the foreign exchange of the USD to SGD is in a sharp retracement of the bullish thrust after a double bullish accumulation pattern was indicated 03 April ’19 with established support at 1.34541.
USDSGD: Weekly Chart

The weekly chart of the USDSGD pair presents excellent swing trading opportunities, starting from a breakout of bearish resistance on 25 March ’19 with set support at 1.34541, and followed by an increase in selling pressure on 27 May ’19 which indicates a recovery of the Singapore economy.
USDSGD Daily Chart

On 01 May ’19, an increase in the foreign exchange of USD to SGD was initiated by a bullish Fakey pattern, followed by a break of bearish resistance on 13 and 16 May ’19, as the trend increased by about 1.5%.
A regular bearish divergence in combination with an exit of overbought was signaled on 31 May ’19 bringing an end to the bullish trend and setting the pace for a bearish trend. So far, the price has dropped by about 1.3%.
USDSGD H4 Chart
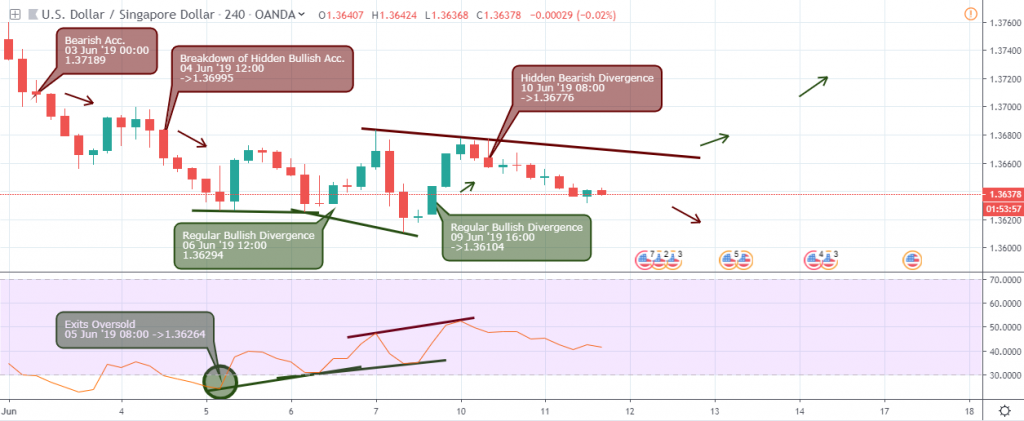
Signaling of bullish and bearish divergence setups in sequence puts the price in an expanding yet descending channel. A breakout of either of the divergence trend lines will serve as a pointer into the trend direction.
USDSGD H1 Chart
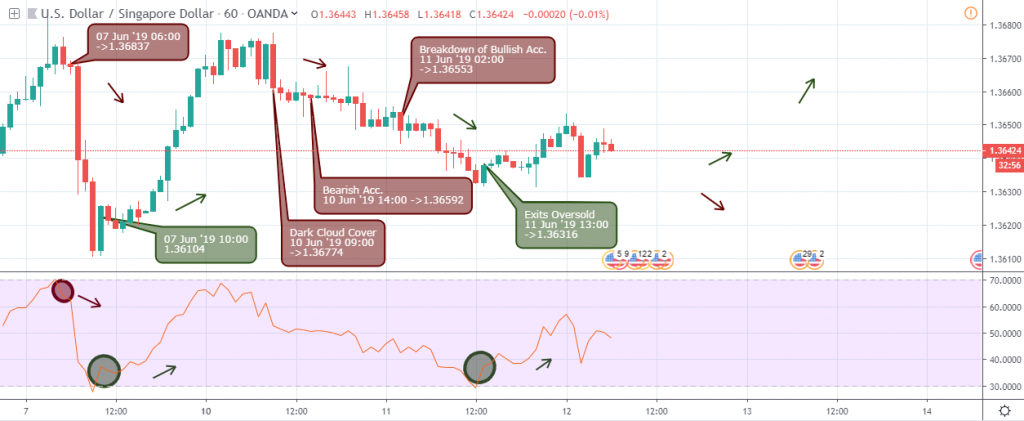
Closely following the RSI oscillator, we can capture intraday overbought and oversold swings in the market at the 6th and 10th hour of 07 June ’19; and recently on 11 June ’19 13:00.
The recent exit of oversold and bullish Fakey setup shows good potential for an upward swing in favor of the USD.
Conclusion and Projection
The bearish descent of the USDSGD starts slowing after entering the support zone of the double bullish accumulation on 01 April ’19. As bullish divergence on the 4hour timeframe, establish support within the dual bullish support on the weekly time frame, the bears may lose their grip, and the gains of the Singapore dollar might not stand the test of time.

I've been a professional trader for over 5 years.
Currently I work as forex analyst for different investment companies.
- EURUSDWeekly outlook – 7th January 2022 - January 7, 2022
- BTCUSD – Weekly outlook for Bitcoin Price – 23rd December 2021 - December 24, 2021
- USDSGDWeekly outlook for Singapore Dollar – 17th Dec 2021 - December 17, 2021
Tagged with: usdsgd