
USD/SGD Weekly Analysis for Singapore Binary Options
Contents
Introduction
For two weeks in a row now, the USDSGD pair has been closing bullish, indicating weakness of the Asian tiger’s economy. Read on for our views on the past and current happens in the Singapore economy.
Singapore Consumer Price Index (CPI)

As a fundamental indicator that measuring price change of goods and services from the consumers perspective, the Singapore CPI came out positive and equates to the forecast. The September 24 data for the CPI came out 0.7% for actual same as the forecast and 0.6% being the previous result.
This data according to investing.com was considered to be of medium impact to the exchange rate. The dollar continued to dominate the Singdollar moving forward.
Singapore Bank Lending
The data released for bank lending in Singapore came out as 669.9B, a figure higher than the previous 667.5B. Although a higher than expected result should be favourable for the Singdollar, this report is considered to be of low impact.
Technical
Though most binary options traders do not reference the monthly chart in their analysis, not to mention a top-down approach to the market, we’ll do it all the same as it offers a broader view of the market.
USDSGD: Monthly Chart
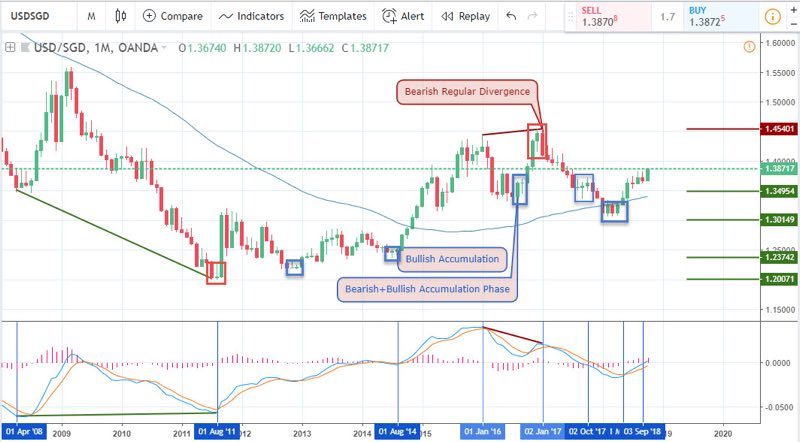
The monthly chart heads north as the USD continues to dominate the Singapore dollar. Looking back 3 months, the price was in a rising congestion region, and it appears to be breaking out of the zone at the moment.
USDSGD: Weekly Chart
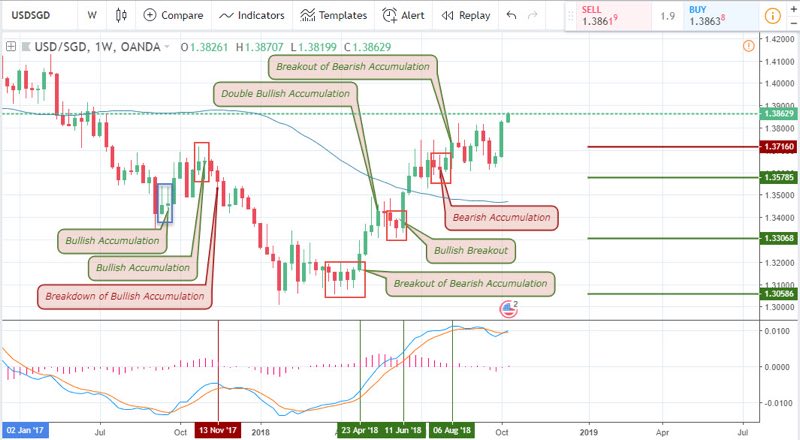
Going on a way back machine to the 13th of November, price triggered a breakdown of a bullish accumulation pattern, and it continued in consecutive bearish closing candles. Towards the end of the bearish trend, price entered into congestion and later a bearish accumulation pattern. On the 23rd of April, price finally broke out of the bearish accumulation pattern switching the trend from bearish to bullish.
This breakout move continued until it established a double bullish accumulation pattern which was later followed by some bearish closing candles. The bulls resumed their dominance and continued to push the price even further above the 65 periods moving average where it set up another bearish accumulation pattern. Another and more recent breakout of the bearish accumulation pattern was fired on the 6th of August.
Starting from 23rd April and all the way to August 6th, the price established critical support levels at 1.30586, 1.33068, and 1.35785.
USDSGD: Daily Timeframe
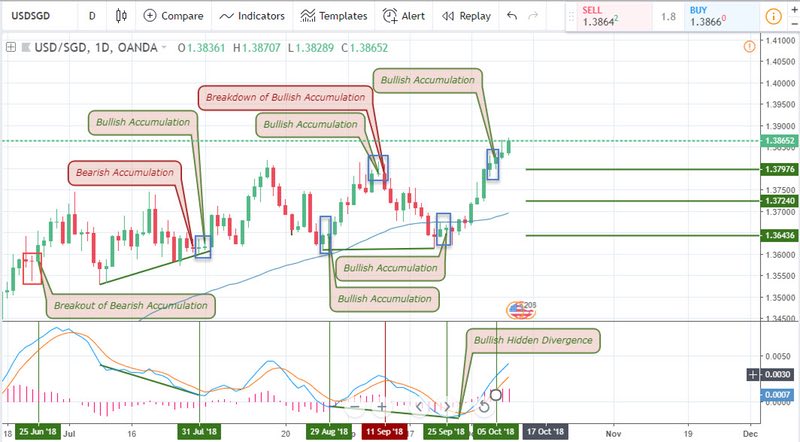
The above daily chart offered swing trading opportunities, though better buying setups than shorts. Starting from 25th June, price broke out of a bearish accumulation pattern with tight stop loss and a good risk to reward ratio. A bullish hidden divergence that coincides with a bullish accumulation pattern was triggered on the 31st of July, later putting the price into bullish consecutive candles.
Sitting on the 65-day moving average, price again formed a bullish accumulation pattern that sets price up for another upswing. A breakdown of a bullish accumulation pattern was fired on September 11, paving the ground for a downward swing.
As price trades slightly below the 65 periods moving average, a bullish accumulation pattern triggered the current trend. The same level of the bullish accumulation pattern, a bullish hidden divergence pattern was also triggered, form a confluence of events.
Important support levels from the bullish divergence and accumulation pattern of September 25 are 1.36436, 1.37240, and a more recent support of 1.37976 on 6th October.
USDSGD: 4-HOURLY Timeframe
A closer to serious short-term binary options traders is the 4hourly timeframe. Just like the daily chart, the pair maintains a bullish outlook, starting with a bullish accumulation pattern on the 27th of September which establishes a support level at 1.36436. Next was a breakout of a bearish accumulation pattern on 2nd October, also with a support level at 1.37240. Another breakout of bullish accumulation pattern at 1.38029 on October 5.
A regular bearish divergence pattern was expected to cause a trend change, but it failed to do this despite a bearish accumulation pattern formed at the same time. Price currently trades above the previous bearish divergence resistance of 1.38589.
USDSGD: 2-Hour Chart
The bearish divergence pattern formed on the 4-hourly chart was also formed on the 2hour chart (8th October). As an update to our analysis, another bearish divergence pattern was recently triggered on the October 9 as illustrated on the chart above. The above chart shows critical support and resistance levels at 1.38725, 1.38226, 1.37813, and 1.37320.
Conclusion
Even as the USDSGD pair is currently trading in a downward trend, we are constantly keeping track of patterns to support both call and put binary options trades. For a recommendation of Singapore binary options broker, visit our brokers’ section.
Our Recommended Singapore Binary Options Brokers to trade USD/SGD
Best Regulated Broker: IQ Option

IQ Option is the world’s leading EU regulated financial broker based with a revolutionary platform for all traders. Very popular for crypto and USD/SGD trading. Read IQ Option Singapore review
- Best Trading App for Binary Options
- Minimum Deposit of only $10
- Minimum Trade of $1
- Trusted Broker
- $10,000 Virtual Funds ( Demo Account )
- Quick Withdrawals
- Outstanding Platform
- Weekly Tournaments
- Gain up to 98%*
Best Binary Options Broker: Olymp Trade

Olymp Trade is an award winning binary options broker with an excellent trading platform support and education tools. Read Olymp Trade Review
- Risk-Free Trades
- Minimum Deposit of only $10
- Max. 90% Payout
- $10,000 Free Demo account
- Free TrainingEducation : 18 Indicators, 7 strategies and 28 webinars 25% Deposit s
- Certified Platform
- Quick withdrawals
Best Binary Bonus: Binomo

Binomo is a regulated binary broker with a wide range of assets to trade and amazing promotions ( bonus, tournaments prizes,..) .Read Binomo Review
- 25% Deposit Bonus ( 100% Bonus VIP accounts )
- Minimum Deposit of only $10
- Minimum Trade of $1
- Max. 95% Payout
- $1,000 Virtual Funds ( Demo Account )
- Weekend trading
- Free training
DISCLAIMER

I've been a professional trader for over 5 years.
Currently I work as forex analyst for different investment companies.
- EURUSDWeekly outlook – 7th January 2022 - January 7, 2022
- BTCUSD – Weekly outlook for Bitcoin Price – 23rd December 2021 - December 24, 2021
- USDSGDWeekly outlook for Singapore Dollar – 17th Dec 2021 - December 17, 2021