
Bitcoin to USD weekly outlook for Bitcoin Brokers
Contents
Introduction
Since the opening of the month of July, we’ve had a generally bearish outlook on the BTC to USD pair from a monthly perspective. However, intermediate oscillatory runs, both bullish and bearish may occur on the lower time horizons such as daily, 4-hourly and 2-hourly charts. Sit back and read on as we take a look at the recent fundamental and technical happenings in the crypto space.
Fundamentals
Speculative Demand
The fourth largest crypto exchange, Huobi has opened registration to U.S based clients in some specified states through their new platform for U.S. based strategic partners. This initiative was through HBUS, a company based in San Francisco. Starting from 6th July, some U.S residents can now send a request for account verification, and further make cryptocurrency deposits in Bitcoin, Ethereum, Litecoin, etc. Prior to getting full clearance from regulators, HBUS will not be opened to residents of Washington, Vermont, Hawaii, North Carolina, New York, Louisiana, Georgia, Connecticut, and Alabama
Regulatory and Security Adoption
Earlier parts of April this year, the Reserve Bank of India (RBI) made an announcement to no longer offer services to individuals, entities or institutions that operate in cryptocurrencies. The Supreme Court of India denied an injunction against the Reserve Bank of India, and further iterated that the high court would no longer accept any petition filling against the RBI. The injunction against the RBI was postponed from May to 20th of July.
The implication of this is that the July 5th ultimatum to ban all cryptocurrency business will affect such investors negatively, as they will not be able to convert their crypto holding directly to Indian Rupees. Zebpay, a leading crypto exchange in India announced that it would be freezing withdrawal and deposits prior to the ban taking off.
Technical Analysis
Let’s do a thorough housekeeping with technical analysis, starting from the monthly chart, all the way down to the 2-hourly chart.
BTCUSD: Monthly Chart

The monthly chart still remains bearish from a general overview, as most of the candles close lower than their opens, starting from the beginning of this year and into the 2nd quarter. Although the price of the month of July is currently trading above the monthly opening price, we consider this to be the high wick of a bearish candle to come.
BTCUSD: Weekly Chart
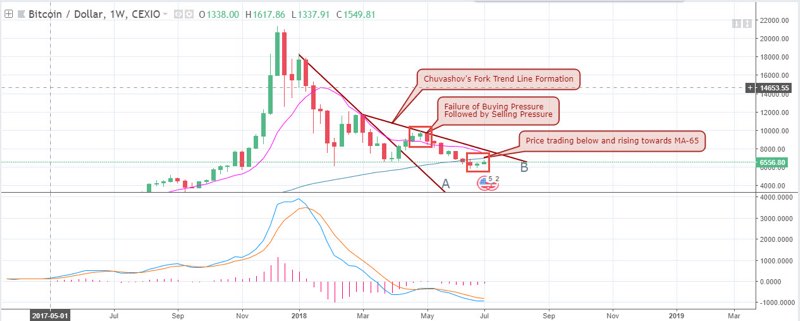
From the above chart, we decide to make reference to the Chuvashov’s fork formation, as price moves close to the B-trend line. Price close above this trend completely changes the trend polarity of the pair. However, considering the consecutive candlesticks analyzed on the monthly time frame we currently hold on to long-term Short-selling.
BTCUSD: Daily Chart
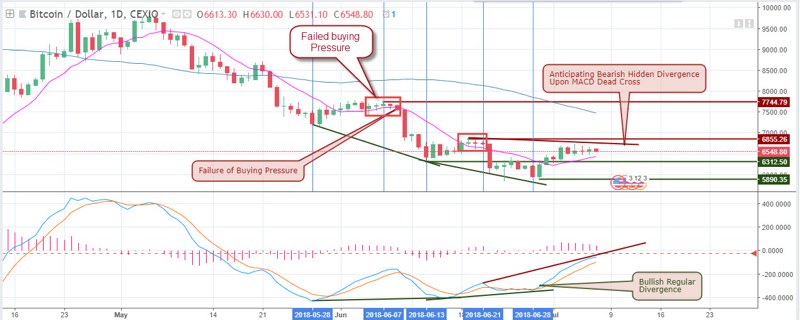
The 28th of last month ushered in the low price that succeeded the MACD golden cross. The bullish regular divergence that followed brought optimism to the bulls and possible recovery of Bitcoin price. Last week’s anticipated bearish hidden divergence has not been triggered by a dead cross, and price close above the $6892.00 resistance has not yet been triggered. A close above this resistance gives more optimism to the bulls and negates the anticipated bearish divergence.
BTCUSD: 4-hour Chart
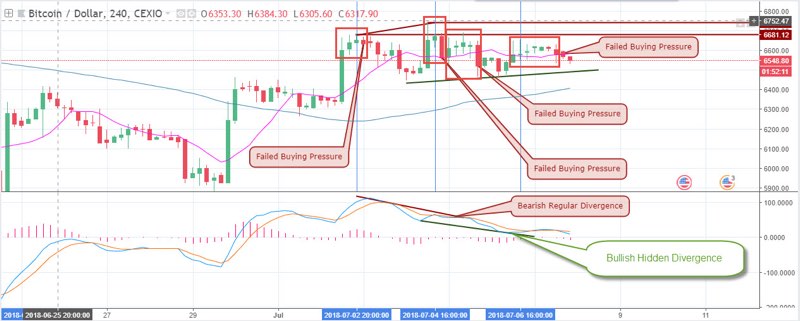
The 4-hour chart brings us closer to the meat and potatoes of a weekly overview. Last week came with an oscillatory rollercoaster ride. First with a bearish regular divergence pattern forming on the 4th of July. As the week winds down to a close on 6th, an opposite bullish hidden divergence pattern was formed. Moving forward into the new week, a close below the bullish hidden divergence trend line, as well as the 65 periods Moving Average, will cancel the bullish signal. While this article is written, the pair is still in a short-term uptrend, which may be opportuntites for placing pending sell orders upon formation of a bearish signal.
BTCUSD: 2-hour Chart
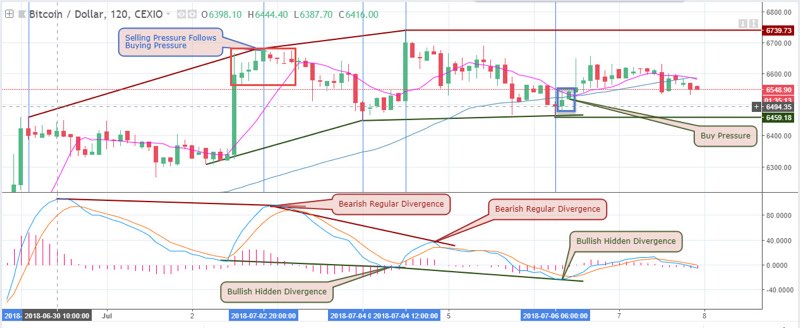
For a clear view of last week’s rollercoaster, we turn to the above 2-hour chart. The pair first started off with a bearish regular divergence pattern on the 02-07-2018, next was an opposite bullish hidden divergence pattern on early hours of 04-07-2018, followed by another bearish regular divergence pattern on the same 4th of July, but late hours. Lastly, the pair finished with a bullish hidden divergence pattern on 06-07-2018.
Conclusion and Projection
As the new week unfolds, we’ll be assigning equal volumes to both high probability Long and Short signals moving forward. However, we’ll be keen on adding to our Short positions compared to the Longs, should the opportunity presents itself. Considering that Short-selling setups agree with our long-term monthly time frame direction.
Our Recommended Bitcoin Brokers to trade BTC to USD
Best Regulated Broker: IQ Option

IQ Option is the world’s leading EU regulated financial broker based with a revolutionary platform for all traders. Very popular for crypto trading. Read IQ Option review
- Best Trading App for Binary Options
- Minimum Deposit of only $10
- Minimum Trade of $1
- Trusted Broker
- $10,000 Virtual Funds ( Demo Account )
- Quick Withdrawals
- Outstanding Platform
- Weekly Tournaments
- Gain up to 98%*
Best Binary Options Broker: Olymp Trade

Olymp Trade is an award winning binary options broker with an excellent trading platform support and education tools. Read Olymp Trade Review
- Risk-Free Trades
- Minimum Deposit of only $10
- Max. 90% Payout
- $10,000 Free Demo account
- Free TrainingEducation : 18 Indicators, 7 strategies and 28 webinars 25% Deposit s
- Certified Platform
- Quick withdrawals
Best Binary Bonus: Binomo

Binomo is a regulated binary broker with a wide range of assets to trade and amazing promotions ( bonus, tournaments prizes,..) .Read Binomo Review
- 25% Deposit Bonus ( 100% Bonus VIP accounts )
- Minimum Deposit of only $10
- Minimum Trade of $1
- Max. 95% Payout
- $1,000 Virtual Funds ( Demo Account )
- Weekend trading
- Free training
DISCLAIMER

I've been a professional trader for over 5 years.
Currently I work as forex analyst for different investment companies.
- EURUSDWeekly outlook – 7th January 2022 - January 7, 2022
- BTCUSD – Weekly outlook for Bitcoin Price – 23rd December 2021 - December 24, 2021
- USDSGDWeekly outlook for Singapore Dollar – 17th Dec 2021 - December 17, 2021
Tagged with: btcusd