
BTC/USD weekly outlook for Bitcoin price
Contents
Following a huge decline in Bitcoin price from an all-time high of about $19623 to current annual low of $5850, the cryptocurrency pacesetter continuously range in what seems to be a bullish hidden divergence setup. Though this pattern is not confirmed by our custom RSI oscillator indicator, it is however confirmed by the MACD (21,9,5) oscillator’s golden cross, time will tell how this plays out. The current ranging pattern in the chart below indicates a drain in speculative demand on Bitcoin broker/Exchanges, which aligns with the range price experienced in the pair as trade volume in May oscillates around the $500million USD zone.
Speculative Demand

Fundamentals
News having a negative impact on the pair this week includes the investigation on Upbit, a South Korean cryptocurrency exchange, as well as fresh news on selling of fresh Bitcoin by the Japanese exchange, Mt. Gox. The visit by South Korea’s Supervisory commission was believed to create panic selling of bitcoin, which resulted to a failure of established support levels. Also the executives responsible for refunding the funds of users of Mt.Gox, a Japanese exchange that crashed in 2014 have sold out a huge chunk of about 8000 BTC.
The introduction of Bitcoin Futures by the Chicago Mercantile Exchange gave Bitcoin pessimist an opportunity to Short Bitcoin leading to a rapid decline in Bitcoin price against the United States Dollar as we are currently experiencing.
The investment bank giant Goldman Sachs says Bitcoin is not a fraud and will offer contracts with Bitcoin exposures as clients need for Bitcoin holdings increases. Also most market maker brokers popularly known for trading in traditional fiat currencies like the EURUSD, GBPUSD, and USDJPY etc. are now introducing cryptocurrencies. Evolve market is a leader in this area, as a Bitcoin broker having its clients’ accounts denominated in Bitcoin. More regulated brokers like FXPRO, and ForexTime are not left out in the race for offering crypto assets for trading.
Technical Analysis
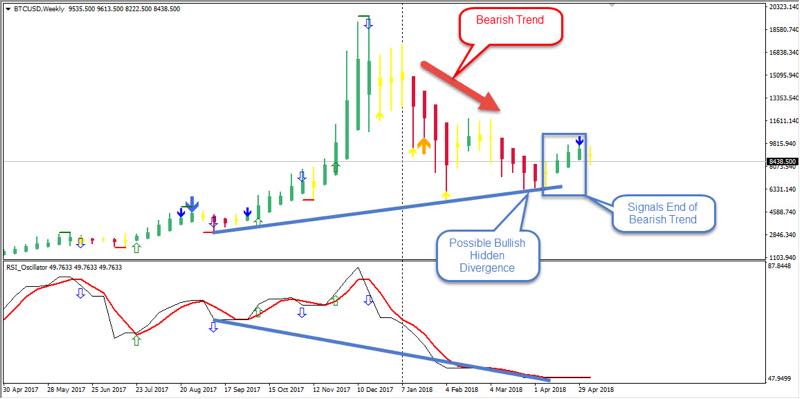
The BTCUSD weekly chart above shows the pair for the first time coming out of a long bearish trend signaled by the Heiken Ashi consecutive bullish bars. Although the pair is making its’ way out of the bearish trend, a zoom in to the daily chart for a clear view of this week’s price action illustrates a bearish setup, signaled by a bearish regular divergence. This price setup confirms the negative fundamentals in the Bitcoin crypto space.
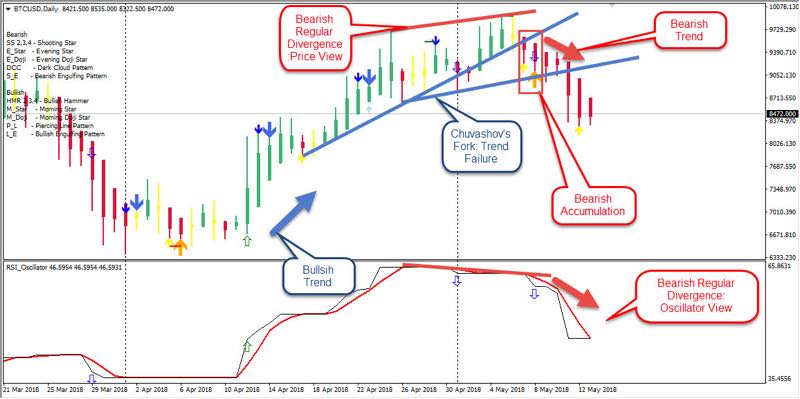
Another useful setup is that formed by the Chuvashov’s fork established by trend lines on the same daily chart. This was also followed by bearish accumulation patterns illustrated with a yellow arrow as symbol. A confluence of these signals(Bearish divergence, Chuvashov’s fork, Bearish accumulation) on the same daily chart confirms that this week was a bearish one for the BTCUSD currency pair.
CONCLUSION
With a change in direction of the daily chart trend from bullish to bearish following the Heiken Ashi candles; we expect the bearish move to continue, unless a significant technical or fundamental announcement favors the Bitcoin price moving forward into the new week. This bearish move is considered short term as the weekly chart shows newly established bullish trend and more of a long term pattern.
Our Recommended Broker for Bitcoin price : IQ Option
Best Regulated Broker: IQ Option

IQ Option is the world’s leading EU regulated financial broker based with a revolutionary platform for all traders. Very popular for crypto trading. Read IQOption review
- Best Trading App for Binary Options
- Minimum Deposit of only $10
- Minimum Trade of $1
- Trusted Broker
- $10,000 Virtual Funds ( Demo Account )
- Quick Withdrawals
- Outstanding Platform
- Weekly Tournaments
- Gain up to 98%*
DISCLAIMER

I've been a professional trader for over 5 years.
Currently I work as forex analyst for different investment companies.
- EURUSDWeekly outlook – 7th January 2022 - January 7, 2022
- BTCUSD – Weekly outlook for Bitcoin Price – 23rd December 2021 - December 24, 2021
- USDSGDWeekly outlook for Singapore Dollar – 17th Dec 2021 - December 17, 2021
Tagged with: bitcoin price • btcusd