
Bitcoin to USD weekly outlook for bitcoin Brokers
Contents
Introduction
A new week is here with huge bearish sentiments in the cryptocurrency space as the market cap drops to about USD111.9Bln. The atmosphere has not been favourable, as there’s been huge selling pressure of the BTC on major Bitcoin brokers/exchanges, along with serious speculative adoption.
Regulatory Adoption
Regulators in the United States, the FINRA and SEC have recently filed objections against non-compliant crypto players, that falsified their business activities. The first company to be bashed by FINRA was Timothy Tilton Ayre was charged for the illegal distribution of an unregistered altcoin Hempcoin(HMP). On September 11, a New York Judge made a ruling that crypto fraud allegations can be prosecuted by the application of securities laws. This was in a case with one Maksim Zaslavsky, a Brooklyn resident.
Blockchain Adoption
Based on a report published on the 14th of September, over 65 blockchain use cases have been outlined by the World Economic Forum (WEF). Through the use of new financial models for environmental outcomes, the realization of natural capital, the WEF can boost environment protection efforts. Other game-changing initiatives for managing environmental issues such as decentralized energy, water management systems to mention a few.
Technical Analysis
Bitcoin price is heading for a highly probable price drop, and the centre ($6115.00) does not appear as if it’ll hold any much longer. Read on to get an understanding of our technical overview.
BTCUSD: Monthly Chart

Looking at the monthly chart of the BTCUSD pair, it’s obvious we are in a longer-term bearish trend, as the bearish accumulation price action pattern formed around February lead the way. The Highest high of 21283.69 was followed by a series of consecutive resistance on the highs of February and March. The month of August closed bearish and September is already showing signs of bearish sentiment. A bearish close within the range of August will trigger a bearish accumulation pattern, which could send the BTC to USD exchange rate further south.
BTCUSD: Weekly Chart
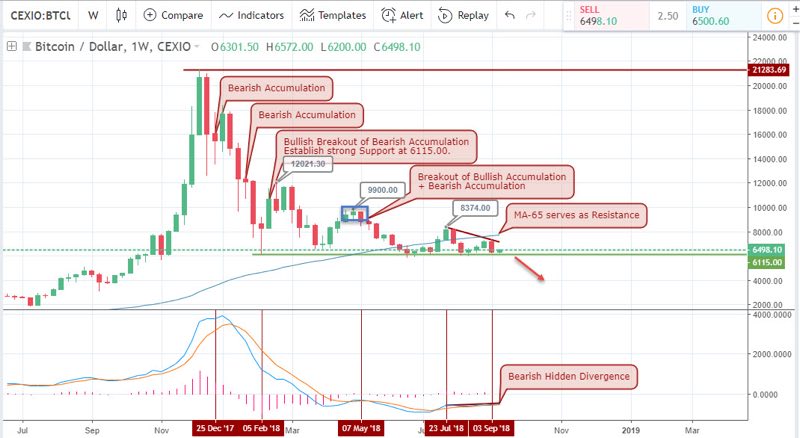
As the weekly chart of the BTC to USD pair shows a series of lower high, it becomes more obvious the pair is in a strong downward trend. New insights from the above weekly chart point to the bearish hidden divergence pattern triggered on the 3rd of September. Going backwards to 5th February, the bearish accumulation pattern failed to a bullish breakout setting up a strong bullish support at $6115.00 which has been a hindrance to attaining new lows.
BTCUSD: Daily Chart
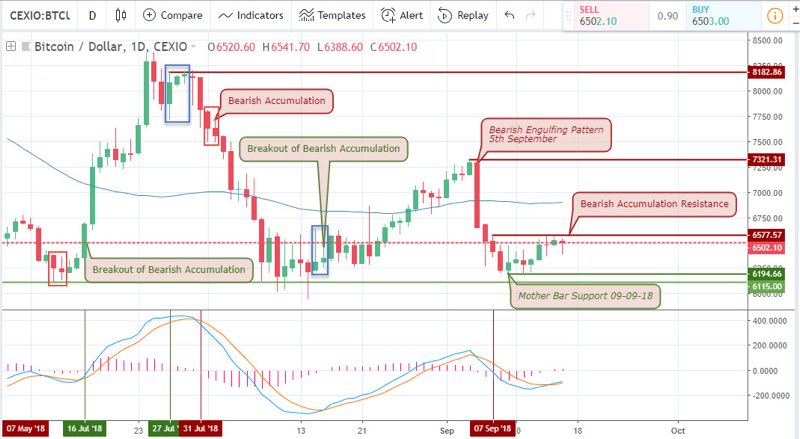
It’s been a downward riding rollercoaster as the pair breaks through a bearish accumulation pattern into a bullish trend on July 16 and later broke through a bullish accumulation pattern on July 27 after a series of consecutive bullish bars, into a bearish trend. Towards the bullish support of 6115.0, the pair did another breakout of bearish accumulation, pushing the pair further upwards till a surprise long bearish engulfing candle sends the pair tumbling down again. Before even intercepting the 6115.00 support level, price again established a bullish mother-bar support at 6194.66 and September 7 resistance holds down the price.
BTCUSD: 4-hour Chart
Here is where we get an overview of last week’s price dynamics. The early days of the previous week were quite choppy, which appeared as accumulation patterns on the daily chart. Similarly, combinations of bearish and bullish accumulation patterns were also formed on September 7, 9 and 12, forming a strong support at 6194.66 as a result of a breakout of the bearish accumulation pattern.
BTCUSD: 2-hour Chart
A quiet bullish rally continued after a breakout of the bearish accumulation pattern on Tuesday the 11th and quickly picks up speed 12th the next day, sending price rising higher out of a bearish accumulation pattern. Moving into the weekends, price forms a bullish hidden divergence setup which may cause the pair to peak at the early part of the new week. On the other hand, we have a bearish bias towards the pair considering that the higher timeframes are heading south.
Conclusion and Projection
Our weekly projection is definitely towards short-selling, as we expect the higher timeframe to lead the way into breaking the $6115.00 support region. For a recommendation on bitcoin broker/exchanges, check our section on bitcoin brokers.
Our Recommended Cryptocurrencies Brokers to trade BTC to USD
Best Regulated Broker: IQ Option

IQ Option is the world’s leading EU regulated financial broker based with a revolutionary platform for all traders. Very popular for crypto trading. Read IQ Option review
- Best Trading App for Binary Options
- Minimum Deposit of only $10
- Minimum Trade of $1
- Trusted Broker
- $10,000 Virtual Funds ( Demo Account )
- Quick Withdrawals
- Outstanding Platform
- Weekly Tournaments
- Gain up to 98%*
Best Binary Options Broker: Olymp Trade

Olymp Trade is an award winning binary options broker with an excellent trading platform support and education tools. Read Olymp Trade Review
- Risk-Free Trades
- Minimum Deposit of only $10
- Max. 90% Payout
- $10,000 Free Demo account
- Free TrainingEducation : 18 Indicators, 7 strategies and 28 webinars 25% Deposit s
- Certified Platform
- Quick withdrawals
Best Binary Bonus: Binomo

Binomo is a regulated binary broker with a wide range of assets to trade and amazing promotions ( bonus, tournaments prizes,..) .Read Binomo Review
- 25% Deposit Bonus ( 100% Bonus VIP accounts )
- Minimum Deposit of only $10
- Minimum Trade of $1
- Max. 95% Payout
- $1,000 Virtual Funds ( Demo Account )
- Weekend trading
- Free training
DISCLAIMER

I've been a professional trader for over 5 years.
Currently I work as forex analyst for different investment companies.
- EURUSDWeekly outlook – 7th January 2022 - January 7, 2022
- BTCUSD – Weekly outlook for Bitcoin Price – 23rd December 2021 - December 24, 2021
- USDSGDWeekly outlook for Singapore Dollar – 17th Dec 2021 - December 17, 2021
Tagged with: btcusd