
Bitcoin to USD weekly outlook for Bitcoin Brokers
Contents
Introduction
The bearish sentiment continues to linger in the cryptocurrency space, as the exchange rate of BTC to USD plummets further. The cryptocurrency pacesetter is being bashed this week with negative news releases that are believed to be slowing down it mainstream adoption, hence price recovery.
Speculative Adoption
Towards the early parts of December last year, investors have been devising ways to get into the space without having to directly buy the currency. This brought the arrival of Futures products, leading to a rally of the BTC to USD exchange rate to about $20,000 on most exchanges/bitcoin brokers.
The biggest of them all is the introduction of ETFs to investors. The Winklevoss twins made an attempt to get institutional money into Bitcoin via this means around March 2017. However, ETNs(Exchange Traded Notes) which are considered a softer option to the BTC ETFs is what is being sought after at the moment in the U.S.
Regulatory Adoption
The United States SEC are currently sceptical about approving Bitcoin ETFs for institutional investors. The expectation and anticipation of ETFs have resulted in a lot of hype of more Wall Street institutional money being injected into the crypto space. The position of the SEC on this is currently unclear, keeping the Bitcoin vs USD chart in a bearish triangle. More of the bearish triangle in the technical analysis section.
Technical Analysis
BTCUSD: Monthly Chart

Looking at the monthly chart above, nothing much has changed as it reflects the current fundamental atmosphere of the cryptocurrency space. The same bearish accumulation phase on 01, March 2018 is still the technical force behind this move and a price close below the 6171.49 support level signals new lows on the way.
BTCUSD: Weekly Chart
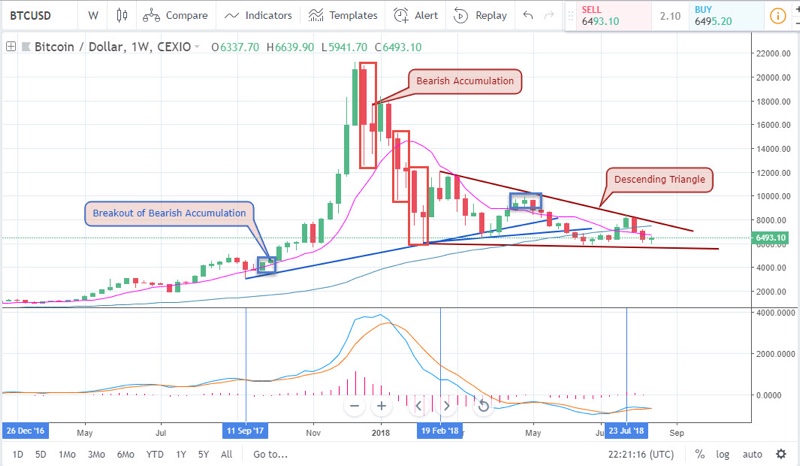
Most obvious on the weekly chart is the descending triangle chart pattern. The pair from this time horizon is inclined towards bearish sentiment. The MACD oscillator also gives clue to the direction the pair is heading, as the signal line oscillates below its zero level.
BTCUSD: Daily Chart
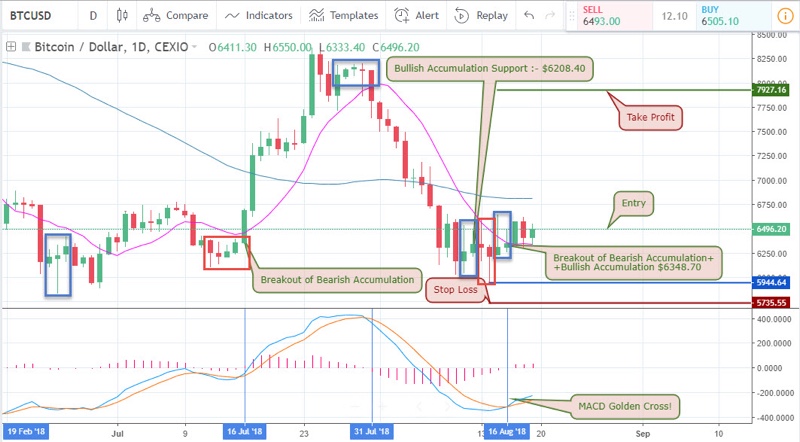
Over here on the daily chart, we get a more granular break down of the monthly chart and get to see the oscillatory nature of the pair as it breaks out of bullish and bearish accumulation patterns into medium-term bullish and bearish swings. Most recent setup formed on the 16th of August is a breakout of the bearish accumulation pattern. This allows for entering a long trade at $6348.70 with a stop loss at $5735.55 and take profit at $7927.16.
BTCUSD: 4-hour Chart
Similar to the daily time-frame is the 4hour chart which offers a further breakdown of the time series and trade setups with tighter stop losses. From the chart above, the pair triggered bearish accumulation at 3 different points at approximately the same support level. The bearish accumulation patterns offered unique supports at 6336.44 and 6303.09 respectively.
BTCUSD: 2-hour Chart
This price chart is the lowest time-frame we consider in our analysis is more oscillatory in its structure. This is why we look out for price and MACD oscillator divergence patterns. From the chart above, a bullish regular divergence pattern is fired as the MACD oscillators do a golden cross, while at the same time a bullish and bearish accumulation breakout was triggered. This pattern clusters alone sends price racing upward to later trigger another bullish hidden accumulation pattern on 19th August.
Conclusion and Projection
Although we often consider a synergy of time-frames of the same pair in our analysis, we may make an exception of trading the time-frames individually in cases where the time horizons do not align. This allows us to switch from a trend-following approach to a swing trading approach. This brings us to a conclusion that, our general monthly time-frame direction still remains bearish, while long-buying opportunities are offered on daily, 4-hourly, and 2-hourly charts. We’ll go with the lower time frame directions with minimal risk, as most bitcoin broker/s allow for placing both long and short trades.
Our Recommended Bitcoin Brokers to trade BTC to USD
Best Regulated Broker: IQ Option

IQ Option is the world’s leading EU regulated financial broker based with a revolutionary platform for all traders. Very popular for crypto trading. Read IQ Option review
- Best Trading App for Binary Options
- Minimum Deposit of only $10
- Minimum Trade of $1
- Trusted Broker
- $10,000 Virtual Funds ( Demo Account )
- Quick Withdrawals
- Outstanding Platform
- Weekly Tournaments
- Gain up to 98%*
Best Binary Options Broker: Olymp Trade

Olymp Trade is an award winning binary options broker with an excellent trading platform support and education tools. Read Olymp Trade Review
- Risk-Free Trades
- Minimum Deposit of only $10
- Max. 90% Payout
- $10,000 Free Demo account
- Free TrainingEducation : 18 Indicators, 7 strategies and 28 webinars 25% Deposit s
- Certified Platform
- Quick withdrawals
Best Binary Bonus: Binomo

Binomo is a regulated binary broker with a wide range of assets to trade and amazing promotions ( bonus, tournaments prizes,..) .Read Binomo Review
- 25% Deposit Bonus ( 100% Bonus VIP accounts )
- Minimum Deposit of only $10
- Minimum Trade of $1
- Max. 95% Payout
- $1,000 Virtual Funds ( Demo Account )
- Weekend trading
- Free training
DISCLAIMER

I've been a professional trader for over 5 years.
Currently I work as forex analyst for different investment companies.
- EURUSDWeekly outlook – 7th January 2022 - January 7, 2022
- BTCUSD – Weekly outlook for Bitcoin Price – 23rd December 2021 - December 24, 2021
- USDSGDWeekly outlook for Singapore Dollar – 17th Dec 2021 - December 17, 2021