
Bitcoin to USD weekly outlook for bitcoin Brokers
Contents
Introduction
Midway into the previous week, the BTC to USD exchange rate triggered a bullish price action mid-term trend reversal pattern. However, as we enter into a new month and a new week, bearish price action patterns along with negative fundamentals currently outs the pair in a bearish trend direction.
Fundamentals
Regulatory Adoption
A South Korean lawmaker Min Byung-dooof the democratic party urges authorities to ease regulations as a way for Initial Coin Offerings to thrive as reported by South Korean financial outlet economy. He further mentioned that the government should legalize ICOs and that prohibition is not the only way, and further emphasized that fraud, speculation, money laundering and other negative factors should be strictly prohibited.
Blockchain Adoption
An interesting news report this week from the Irish Times captured the UK Finance minister Philip Hammond, who stated that a deploy of blockchain technology could resolve issues of trade across the Irish border after Great Britain exits the EU. When this happens, the UK will leave the European Unions Customs Union. The issue of product identification is that which the blockchain is aimed at solving as Maersk announced to launch a blockchain solution with IBM.
Speculative Adoption
Based on a Bloomberg report, “traditional investors and buyers have become deeply involved in the $220 billion crypto markets via private transactions”. Still, from Bloomberg, miners, who happen to sell huge volumes of Bitcoins on the market have initiated moves to schedule selling of coins, compared to their previous actions of HODLing.
Technical Analysis
BTCUSD: Monthly Chart
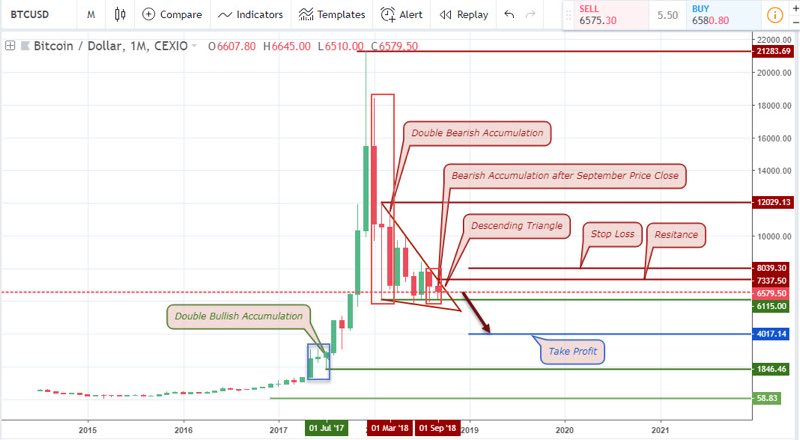
The opening price of the month of October gives birth to a fresh bearish accumulation pattern, which is a very significant price action pattern, especially at this particular time horizon. If you followed our last post, you’ll remember that we’ve had a bearish bias based on the same descending triangle pattern. This freshly formed bearish accumulation pattern offers a clear short-selling opportunity at the opening price of the month or at the current price of $6579.50 from the above image. Stop loss should be placed above the bearish accumulation resistance of $7337.50 at $8039.30 and take profit target at $4017.14.
It’s worth mentioning though, that a price close above the bearish accumulation resistance level of $7337.50 completely changes the trend sentiment of the pair, making this a change in polarity.
BTCUSD: Weekly Chart
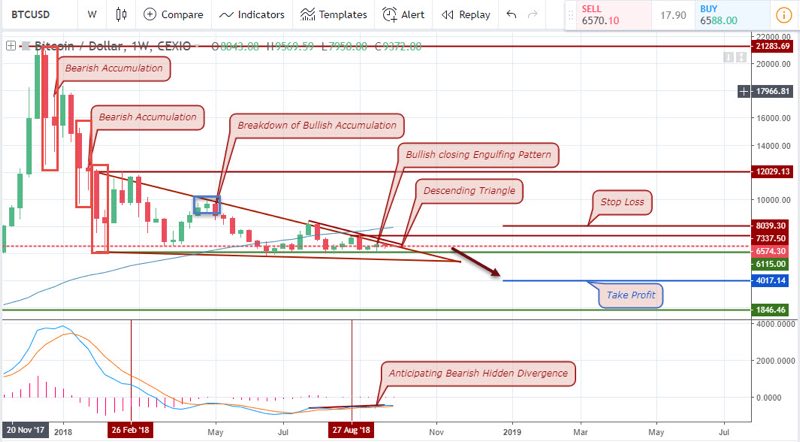
Maintaining the descending triangle of the monthly chart as well as the entry and exit levels, we take it a step further to identify a bearish hidden divergence which is still waiting to be triggered. A dead cross of the MACD oscillator confirms the bearish direction pattern.
BTCUSD: Daily Chart
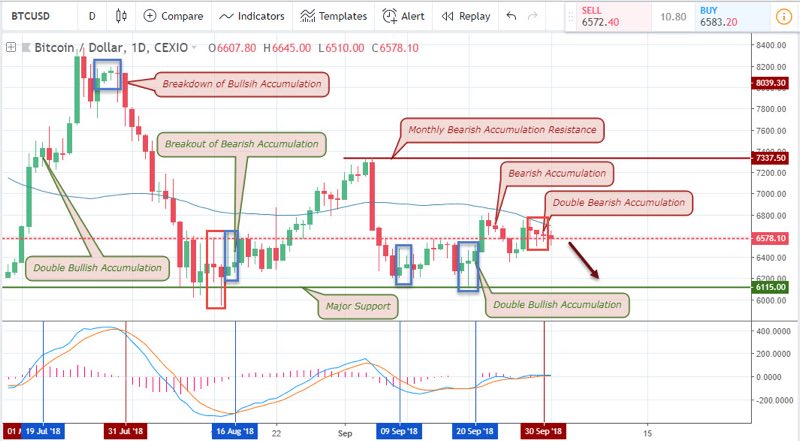
As usual, while carrying a top-down analysis of a pair, and considering that the bearish accumulation patterns of the monthly chart are being referenced, the daily chart will obviously be in an oscillatory motion, offering great opportunities for swing traders to take advantage of the up and down motion as shown on the above chart.
At the moment, a double accumulation pattern is formed with a resistance level at 6655.30 and currently trading under the 65-period moving average. The pair at present offers bearish shorting opportunities. However, if there is a bullish close on this time-frame that closes above the mentioned resistance level, a change in polarity is triggered.
BTCUSD: 4-hour Chart
Bringing us closer to the moment is the 4hr chart where we get to ride short-term trend waves, fired by bullish and bearish accumulation price action patterns. Between the time range September 18th and 25th, price retraced a bullish trend triggered by a breakout of a bearish accumulation pattern and continues with a triple bullish accumulation pattern. The trend correction was triggered by an opposite bearish accumulation pattern which was again followed by another triple bearish accumulation.
Attempts were made by the bulls towards an upward trend recovery, but as you can see from the above chart, a series of bullish accumulation breakdown patterns are observed. Hence we look forward to going short at the current price level with stop loss and take profit levels at $6685.00, and $6300.00 respectively.
BTCUSD: 2-hour Chart
Similar to the 4-hourly chart, the 2-hourly chart follows a bearish outlook as bullish accumulation patterns fail to hold their ground starting from 29th, 30th of September and way into 2nd October.
Conclusion and Projection
As more institutional investors and Bitcoin brokers are replacing high net-worth individuals as biggest buyers coupled with more regular scheduling of coin sales by miners, the BTC to USD exchange rate shows more bearish sentiments. The technical price action patterns on the higher time frame point in the same downward direction and the current week currently offers mid-term opportunities for short-selling trades!
Are you a new or seasoned trader and would like to explore the world of cryptocurrencies? Check out our broker section for our recommendation on bitcoin brokers.
Our Recommended Cryptocurrencies Brokers to trade BTC to USD
Best Regulated Broker: IQ Option

IQ Option is the world’s leading EU regulated financial broker based with a revolutionary platform for all traders. Very popular for crypto trading. Read IQ Option review
- Best Trading App for Binary Options
- Minimum Deposit of only $10
- Minimum Trade of $1
- Trusted Broker
- $10,000 Virtual Funds ( Demo Account )
- Quick Withdrawals
- Outstanding Platform
- Weekly Tournaments
- Gain up to 98%*
Best Binary Options Broker: Olymp Trade

Olymp Trade is an award winning binary options broker with an excellent trading platform support and education tools. Read Olymp Trade Review
- Risk-Free Trades
- Minimum Deposit of only $10
- Max. 90% Payout
- $10,000 Free Demo account
- Free TrainingEducation : 18 Indicators, 7 strategies and 28 webinars 25% Deposit s
- Certified Platform
- Quick withdrawals
Best Binary Bonus: Binomo

Binomo is a regulated binary broker with a wide range of assets to trade and amazing promotions ( bonus, tournaments prizes,..) .Read Binomo Review
- 25% Deposit Bonus ( 100% Bonus VIP accounts )
- Minimum Deposit of only $10
- Minimum Trade of $1
- Max. 95% Payout
- $1,000 Virtual Funds ( Demo Account )
- Weekend trading
- Free training
DISCLAIMER

I've been a professional trader for over 5 years.
Currently I work as forex analyst for different investment companies.
- EURUSDWeekly outlook – 7th January 2022 - January 7, 2022
- BTCUSD – Weekly outlook for Bitcoin Price – 23rd December 2021 - December 24, 2021
- USDSGDWeekly outlook for Singapore Dollar – 17th Dec 2021 - December 17, 2021