
BTCUSD Technical Analysis for bitcoin trading platforms
Contents
Introduction
Last week’s 10th December’s bearish close below its previous 3rd December low of 3301.10 is quickly turning out to be a false break pattern as this week quickly gathers bullish momentum, as well as bullish optimism from Binomo, a binary options trading platform.
Fundamentals
A high percentage of Respondents would Prefer to receive money gifts in the form of Digitatl Currency
The United Kingdom Central Bank recently conducted a survey on twitter which asked how respondents would rather receive gifts at Christmas. A large majority of the respondents would rather receive theirs in Digital currency, while a staggering 21% opted for cash, 7% Bank transfer, and 2% Gift voucher. This from our perspective signals an increase in mainstream adoption.

The above daily chart shows the last significant announcements for the month of December. The bearish accumulation pattern formed just before the launching of Bitcoin on the Bakkt exchange platform hints a further price decline for the BTCUSD. However, further price action development as we’ll later see on the daily chart analysis confirms a switch in the bearish trend direction.
Upcoming Events
December 28 2018 – CME: December Last Trade
Speculators, investors, traders, and Bitcoin hobbyists, wait patiently for the outcome of the last trade date of Bitcoin futures in December. Technical price patterns formed within this time window will play a significant role in determining the direction of Bitcoin price.
Daily Chart of the BTCUSD
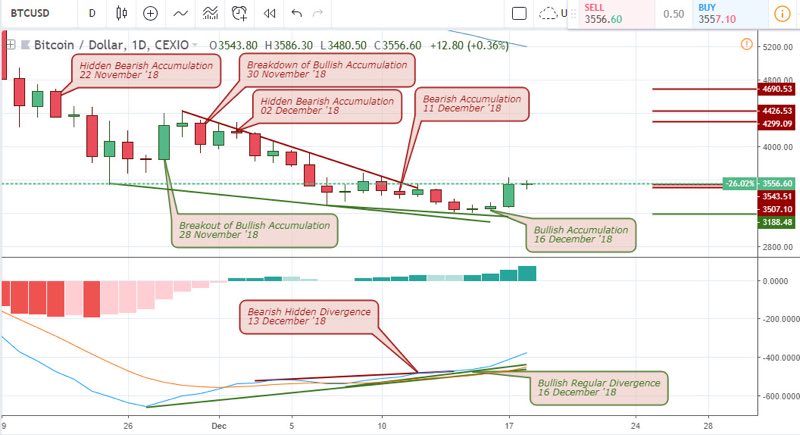
The formation of a hidden bearish accumulation pattern on November 22, established a resistance level at 4690.53. After an attempt by the bulls to take over the market from a breakout of bearish accumulation on 28 November, the bullish accumulation pattern that was later formed after it could not stand the test of time, as it failed to an opposite breakdown of the bullish accumulation pattern resulting in a 20% price drop.
Still from the bitcoin chart above, a bullish hidden divergence pattern was triggered by the bulls indicating an exhausted bearish trend and highly probable retracement. The bears refused an immediate reversal and instead triggered a bearish accumulation pattern which saw price breaking below the previous low of 3535.10.
Finally, the formation of the bullish accumulation pattern triggered the anticipated bullish retracement as bitcoin price climbed by 27.4% on all bitcoin trading platforms.
4-HR Chart of the BTC/USD
A 4hour time horizon of the bitcoin chart, presents low risk entry points for long buy trades. After a failure of bullish accumulation on 13 December, and a bearish accumualtion resistance on 14 Decemebr, the bears could not hold their grounds any longer as increase in bullish pressure forced price to break through critical resistance levels.
Starting from 15 December, a price breakout of bearish accumulation initialized a bullish rally that brought the pair to an 11% gain followed by a 28% gain at the point of publishing this article. From that point onwards, all attempts by bears to bring the pair south have failed to an opposite breakout of bearish resistance. This bullish trend left critical support levels at 3198.99, 3258.91, and 3482.69 respectively.
2-HR Chart of the BTCUSD
A bullish regular divergence triggered on December 15, gave confirmation to the breakout of bearish accumulation pattern on the 4hour chart, and eventually aconfluence of events with the single bullish accumulation pattern on the daily chart. Just like the 4hour chart, the above bitcoin chart (2hour) shows breakout of bearish accumulation patterns on 17 December 06:00 . As a result, these bullish patterns established strong support levels at 3197.90, 3265.37, 3441.11, and 3477.20 respectively.
Conclusion and Projection
Although the current bullish rally triggered by high probability setups on the lower daily, 4hour and 2 hour charts present opportunity for cashing in on a bullish rally, from a longer term perpective this move may not stand the test of time as the bears are still present on the longer weekly and monthly charts.
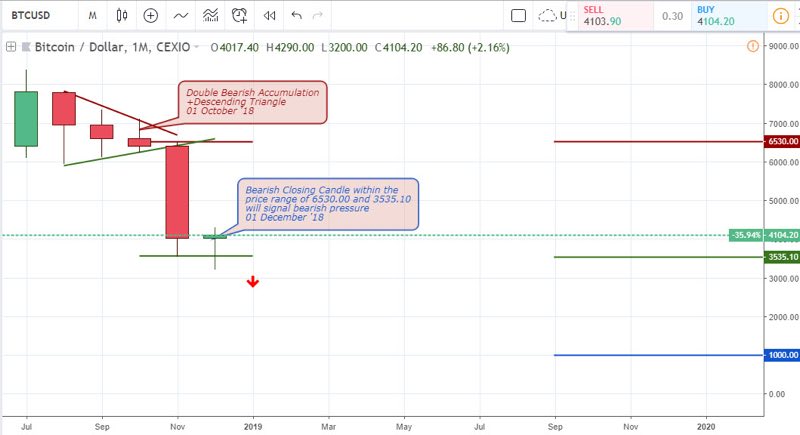
BTCUSD: Monthly Chart

I've been a professional trader for over 5 years.
Currently I work as forex analyst for different investment companies.
- EURUSDWeekly outlook – 7th January 2022 - January 7, 2022
- BTCUSD – Weekly outlook for Bitcoin Price – 23rd December 2021 - December 24, 2021
- USDSGDWeekly outlook for Singapore Dollar – 17th Dec 2021 - December 17, 2021
Tagged with: btcusd