
Bitcoin to USD weekly outlook for cryptocurrencies Brokers
Contents
Introduction
The BTC to USD exchange rate has continually knocked on the 6187.83 price support level, and another rejection is experienced on that level. Traders and HODLers alike hope that this level will lead to the final bullish recovery of the crypto-giant. However, we here from experience understand that hope is not a technical or fundamental indicator of price change. Read on for more insights into the recent happenings on the pair!
Speculative Adoption
Based on a press release by PR Newswire, Abra, a global crypto wallet recently included direct sale and purchase of cryptocurrencies for European bank accounts.
Regulatory Adoption
From India, the (SEBI) Securities and Exchange Board of India had tours to other countries organized for officials to study cryptocurrencies and initial coin offerings ( ICO )..
Blockchain Adoption
Following a post on their website, IBM has announced the emergence of its’ Blockchain World wire payment network from its Beta stage. A solution that makes use of digital assets to settle transactions, which serves as an agreement of store of value transferred between parties. This move by IBM provides fresh competition for Ripple.
Also under blockchain adoption is the number of patents on the blockchain, as Alibaba, IBM, Mastercard, and Bank of America lead the pack.
The industrial and commercial bank of China is also not left out as the organization’s chairman stated on 1st of September that the bank will focus on blockchain technology development.
Technical Analysis
Following a top-down multiple time frame analysis, we start from the monthly chart and work our way down to the hourly charts, where we get a closer perspective into the weeks’ overview.
BTCUSD: Monthly Chart

So far so good, the monthly chart has not changed much, as the 6187.83 support level stands the test of time, at least for now. The month of September opens above this level as August forms a candle pattern similar to a bearish closing hammer. Using the swing high and swing low of 21191.12 and 58.83 respectively, for Fibonacci retracements, we observe that price is below the 38.2% Fib retracement, and the 23.6% retracement appears to be a likely target for short selling traders. Price close below the 6187.83 support should facilitate this.
BTCUSD: Weekly Chart
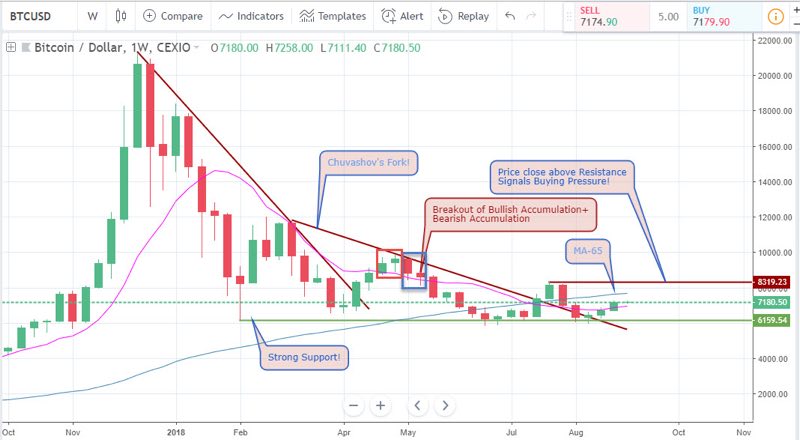
A view of the weekly chart shows the pair trading between a range of support and resistant level of 8319.23 and 6159.54. At the moment the price is pointing towards the resistance price direction. A close above either of these price levels signals huge buying or selling pressure, so from this perspective, we adopt a wait and see approach, though our bias is bearish on this time horizon!
BTCUSD: Daily Chart
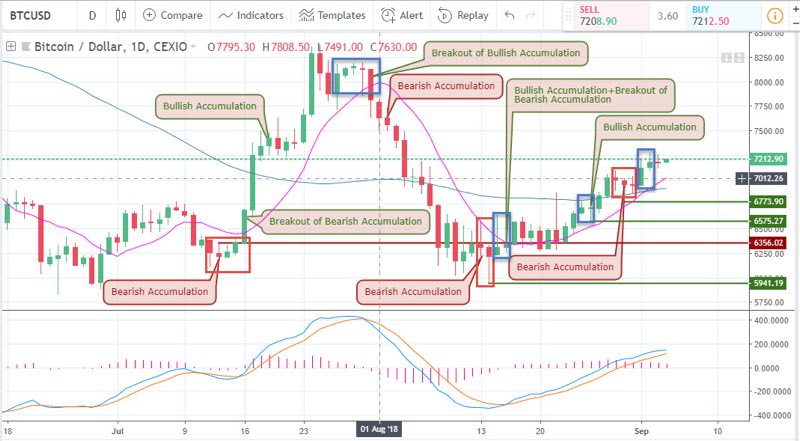
As pointed out from our previous article based on 20th of August, we assumed a bullish trade at $6348.70 with stop loss and take profit at 5735.55 and 7927.16 respectively. This was initiated based off a bullish breakout of bearish accumulation. So far so good, the price is moving in that direction and can lock in a profit by trailing our position, moving our stop loss slightly below the 6773.90 support level.
Most Bitcoin broker/s and exchanges allow for modification of position as a way to reduce the risk of exposure. We chose this level because price recently broke out of a bearish accumulation and the upward trend still looks promising.
BTCUSD: 4-hour Chart
This week from the 4hourly chart has been a roller-coaster firing bearish and bullish divergence signals on August 25th, 30th and most recently on the 3rd of September! The bearish divergence resistance level that failed on August 27th later became a support level in the form of a change in polarity. Also formed at the point of polarity change was a bullish hidden divergence pattern making this an area of confluence of events.
A price close above the highest high of the recent bearish accumulation on the 3rd already signals a weak bearish pressure and sentiments still points towards the upside, as price continues to trade above the 65-period moving average.
BTCUSD: 2-hour Chart
Similar to the 4-hour chart is the 2-hourly chart, also triggering bearish and bullish divergence patterns, this time on the 29th, 30th of August, and September 2nd and 3rd. From this time frame, the price is still very much bullish!
Conclusion and Projection
For there to be a complete change in trader sentiments, the weekly and monthly time frames have to align with the bullish trends on the daily, 4-hourly, and 2-hourly charts. With this observation in mind, the pair may still be bullish on the lower timeframes, but we also look out of shorting opportunities, should the opportunity present itself in the form of a high probability shorting signal.
Our Recommended Cryptocurrencies Brokers to trade BTC to USD
Best Regulated Broker: IQ Option

IQ Option is the world’s leading EU regulated financial broker based with a revolutionary platform for all traders. Very popular for crypto trading. Read IQ Option review
- Best Trading App for Binary Options
- Minimum Deposit of only $10
- Minimum Trade of $1
- Trusted Broker
- $10,000 Virtual Funds ( Demo Account )
- Quick Withdrawals
- Outstanding Platform
- Weekly Tournaments
- Gain up to 98%*
Best Binary Options Broker: Olymp Trade

Olymp Trade is an award winning binary options broker with an excellent trading platform support and education tools. Read Olymp Trade Review
- Risk-Free Trades
- Minimum Deposit of only $10
- Max. 90% Payout
- $10,000 Free Demo account
- Free TrainingEducation : 18 Indicators, 7 strategies and 28 webinars 25% Deposit s
- Certified Platform
- Quick withdrawals
Best Binary Bonus: Binomo

Binomo is a regulated binary broker with a wide range of assets to trade and amazing promotions ( bonus, tournaments prizes,..) .Read Binomo Review
- 25% Deposit Bonus ( 100% Bonus VIP accounts )
- Minimum Deposit of only $10
- Minimum Trade of $1
- Max. 95% Payout
- $1,000 Virtual Funds ( Demo Account )
- Weekend trading
- Free training
DISCLAIMER

I've been a professional trader for over 5 years.
Currently I work as forex analyst for different investment companies.
- EURUSDWeekly outlook – 7th January 2022 - January 7, 2022
- BTCUSD – Weekly outlook for Bitcoin Price – 23rd December 2021 - December 24, 2021
- USDSGDWeekly outlook for Singapore Dollar – 17th Dec 2021 - December 17, 2021