
BTCUSD Technical Analysis for Bitcoin Broker
Contents
Introduction
The cryptocurrency market has maintained a bullish trend across major Altcoins according to IQ Option platform. Bitcoin, the number one coin joins the short term bullish rally and has so far made about 20% gain from a 2hour perspective. Read on to get hints on possible fundamentals that may hint a bearish descent.
BTCUSD: Daily Chart

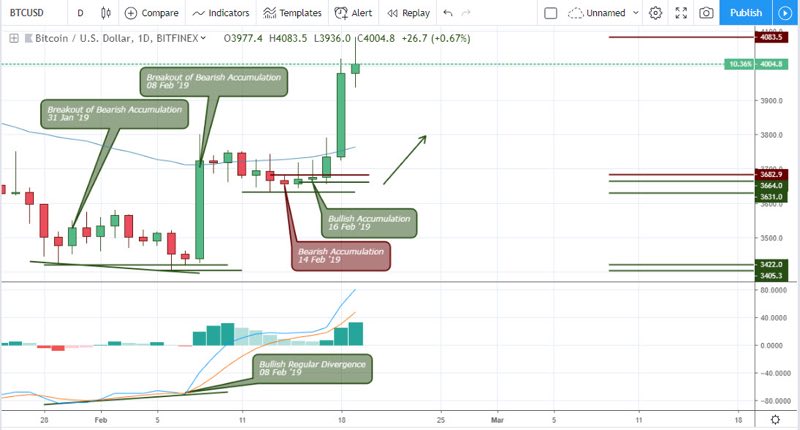
On 30 January and 08 February ’19, double bullish divergence patterns were triggered and finally affirmed a switch from a drained bearish trend towards bullish resurgence. These divergence patterns set up clear support levels at 3422.0 and 3405.3 individually, and the price has not been able to close under these levels.
The experienced a retracement in price after breaking out of the bearish accumulation on 08 Feb ’19. Another bearish accumulation which was expected to bring hope to the bears got truncated by an opposite bullish pressure on 15 February ’19 thereby confirming an end to the retracement and a continuation of the bullish trend.
A view of the updated chart below shows how the trend transition from bearish to bullish finally hit our profit target of 3900.0 and moves beyond it 4083.5, with our stop loss placed below 3631.0.
BTCUSD: Daily Chart – Update
Bitcoin Fundamentals
Bitcoin: In the news
KuCoin zero trading fee Promo at the launch of their trading Platform Version 2.0 21 February 2019
KuCoin exchange in recognition of their KuCoinV2 trading platform is rolling out zero trading fees on all trading pairs. This promotion will be ending on 21 February ’19 at exactly 23:59:59.
CME: February Last Trade 22 February 2019
February 22nd ’19 is the last trading day of Bitcoin futures contract, where all trading should end at exactly 4 PM GMT.
This may be an indicator that aligns with the long term bearish sentiment on the monthly technical charts.
Technical
BTC/USD: 4-HR Chart
The Bitcoin price from the point of view of a 4hour chart shows a bearish accumulation pattern, which later collapsed to a bullish breakout on February 16. Prior to the breakout of bearish accumulation, a bullish fakey was fired in combination with bullish pressure on 14 February showing a rejection of sellers. With a 0.7% risk, price from that point rallied by 3.36%.
BTC/USD: 2-HR Chart
Approaching the BTCUSD from a 2hour chart, we notice that the bullish trend that had climbed about 9.1% from a bullish hidden divergence in combination with a failure of bearish pressure on 17 February ’19 20:00, is starting to show reversal via an opposite bearish regular divergence on 19 February ’19 16:00. This pattern is valid because it is accompanied by a bearish accumulation on the same date.
Conclusion and Projection
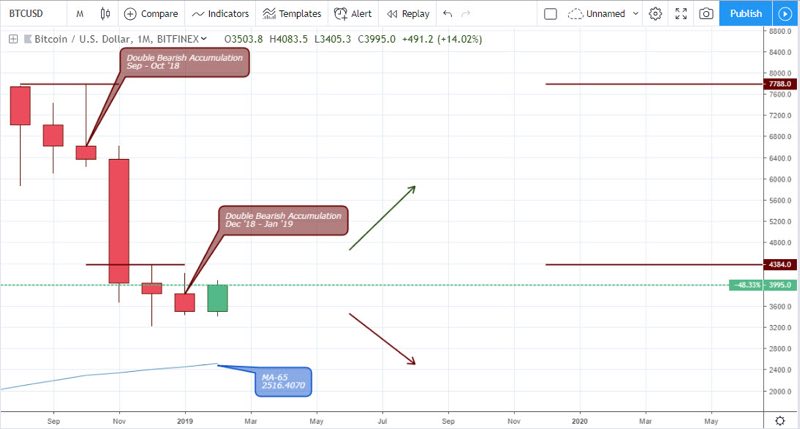
Despite a midterm bullish trend on the lower time frames of the BTCUSD, we still maintain a long term bearish bias on the pair as the critical resistance level of 4384.0 from the double bearish accumulation from December ’18 to January ’19 is not yet touched let alone breached. The pair is projected to reach the MA-65 which is currently about 2516.0 as shown below.
To take advantage of these technical price patterns, you’ll definitely need to check out a list of Bitcoin brokers from the broker section of our site.
BTCUSD: Monthly TF

I've been a professional trader for over 5 years.
Currently I work as forex analyst for different investment companies.
- EURUSDWeekly outlook – 7th January 2022 - January 7, 2022
- BTCUSD – Weekly outlook for Bitcoin Price – 23rd December 2021 - December 24, 2021
- USDSGDWeekly outlook for Singapore Dollar – 17th Dec 2021 - December 17, 2021