
BTCUSD Technical Analysis for Bitcoin Broker
Contents
Introduction
The cryptocurrency market winter of 2018 continues, following a decline in projected rate of institutional adoption of cryptos, as well as main stream adoption. Read on as we touch a few events that support our positions on the BTCUSD pair.
BTCUSD: Weekly Chart

It is obvious from the above weekly chart that the bitcoin price is currently hanging by a thread in the form of a breakout of bearish accumulation support on January 14 ’19. The pair from the same chart offers opposite shorting trade setup in the form of a breakdown of hidden bullish accumulation. A bearish accumulation pattern further reinforced the sell campaign as price already declined by 4.72%.
BTCUSD: Daily Chart
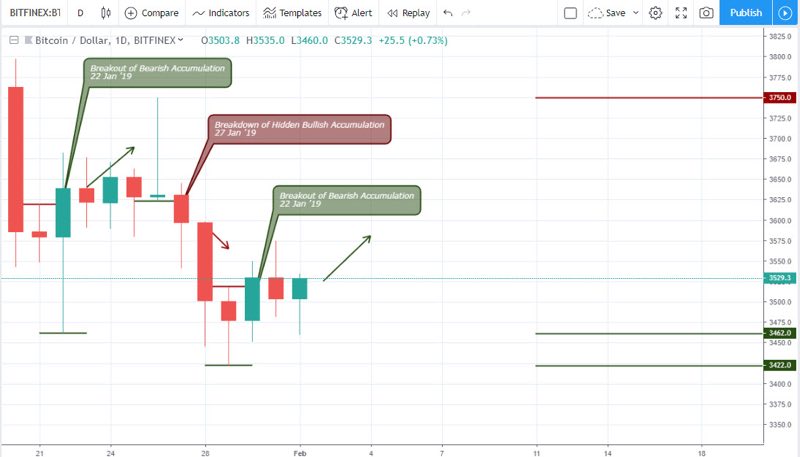
The weekly chart is not the only time frame highlighting the vulnerability of the bitcoin price. Looking at the daily chart above, two similar breakout of bearish accumulation patterns also depict this fact on January 22 ’19 and January 30 ’19. The support levels at 3462.0, and 3422.0 have not yet been breached, however, a bearish accumulation pattern is already signaled on February 4 ’19 serving as an entry to go short.
Bitcoin Fundamentals
Bitcoin: In the news
Fundstrat warns of possible decline of Altcoins and Bitcoin prices
According to a publication on Bloomberg, Robert Sluymer an analyst at Fundstrat recently made a forecast that Bitcoin price, as well as other altcoins, could continue the bearish decent towards the $2270.00 price zone. He hinged this on the weakness of the price structure of most cryptos as well an analysis conducted deploying the firm’s advanced/decline indicator.
It supports our position of shorting based on the double bearish accumulation on the weekly chart.
Technical
BTC/USD: 4-HR Chart
A view from a 4hour perspective illustrates a rollercoaster flow of the pair, which best serves swing traders. This was intiated by a breakdown of bullish accumulation at 08:00 of Jan 31 ’19, followed by alternating breakout and breakdowns on February 01, and 03’19. The pair finally crashed south on impact with the MA-65.
BTC/USD: 2-HR Chart
Formation of a bearish divergence pattern in a general bearish directional market is considered high probability setup, as shown on the above 2h Chart. This pattern was followed by a bearish accumulation February 03 ’19 04:00 presenting an early entry setup, even before a dead cross confirmation of the MACD oscillator.
Prior to publishing this article, we observe a breakout of bearish accucmulation still from the chart above which could be suitable for scalp trading on 06 February ’19 20:00.
Conclusion and Projection
The monthly time frame has so far been the dominant and determinant of the trend direction of the BTC. The lower weekly and daily charts on the other hand, seem to show support to a bullish dorectional change, but we do hold on to the notion of the monthly chart winning at the end of it all.
BTCUSD: Monthly Chart
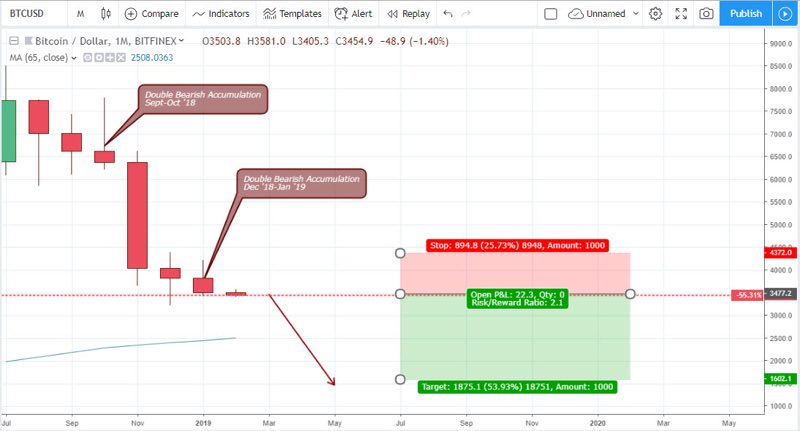
The monthly time series chart of Bitcoin paired against the U.S dollar as shown above, has been closing bearish from August 2018 to January 2019. Formation of bearish accumulation on September and October 2018 present entry setups for short sell trades, from which the bitcoin price plummet by 49.0% compared to a 22.49% risk from the accumulation resistance of 7788.0.
Moving forward, another double bearish accumulation pattern is triggered spanning between December 2018 and January 2019. This pattern sets a strong resistance at 4384.0 and 4218.0, from which a short sell trade from February opening price of 3503.8 is projected to attain a 53.93% target, against a 25.73% risk.
Looking for a cryptocurrency broker? Then look no further, visit the broker section of our site to test different cryptocurrency platform, like Binomo, at little or no risk as most of them offer demo accounts for strategy and trade executions.

I've been a professional trader for over 5 years.
Currently I work as forex analyst for different investment companies.
- EURUSDWeekly outlook – 7th January 2022 - January 7, 2022
- BTCUSD – Weekly outlook for Bitcoin Price – 23rd December 2021 - December 24, 2021
- USDSGDWeekly outlook for Singapore Dollar – 17th Dec 2021 - December 17, 2021