
Bitc0in Price Forecast
Contents
Introduction
The number one cryptocurrency has surprised OlympTrade investors trading the digital asset in the cryptocurrency market with the bullish run in the last four trading weeks. The asset has made about 71% rise from the low of 29000 to the current level of BTC price of 50000 at the writing of the report.
BTCUSD Technical Analysis
Monthly Chart

Monthly Resistance Levels: 65000, 41502, 47440, 59860
Monthly Support Levels: 37000, 30000, 41502
The previous month’s closing candle engulfed June’s candle and it signal buyers dominating the market from that position of 30000 price level with about 47% and the volume was about 79.986K at the close of July. As of today, the bullish surge has hit about 71.88% since they took over the market. If the bullish momentum continues, we may see the hit the 59860 levels, which will expose the 65000 highs. However, if the bulls rally fades out, we shall see the sellers push back the price to the 47440 zones.
Weekly Chart

Weekly Resistance Levels: 65000, 59860, 41500, 53160
Weekly Support Levels: 53160, 46950, 36980
The BTCUSD price successfully broke above the 41500 level to go above the 46950 levels, showing that the Bulls were able to dominate the market despite the strong bearish pressure some weeks back.
There are some levels of resistance that the bulls need to overcome if the previous bullish trend must continue. The 53160 and 59860 levels are strong blocks the Buyers must close above for the bitcoin price to surge higher. If the buyers can not go above the zones, we shall see the market drop to a low of 46950.
Daily Chart
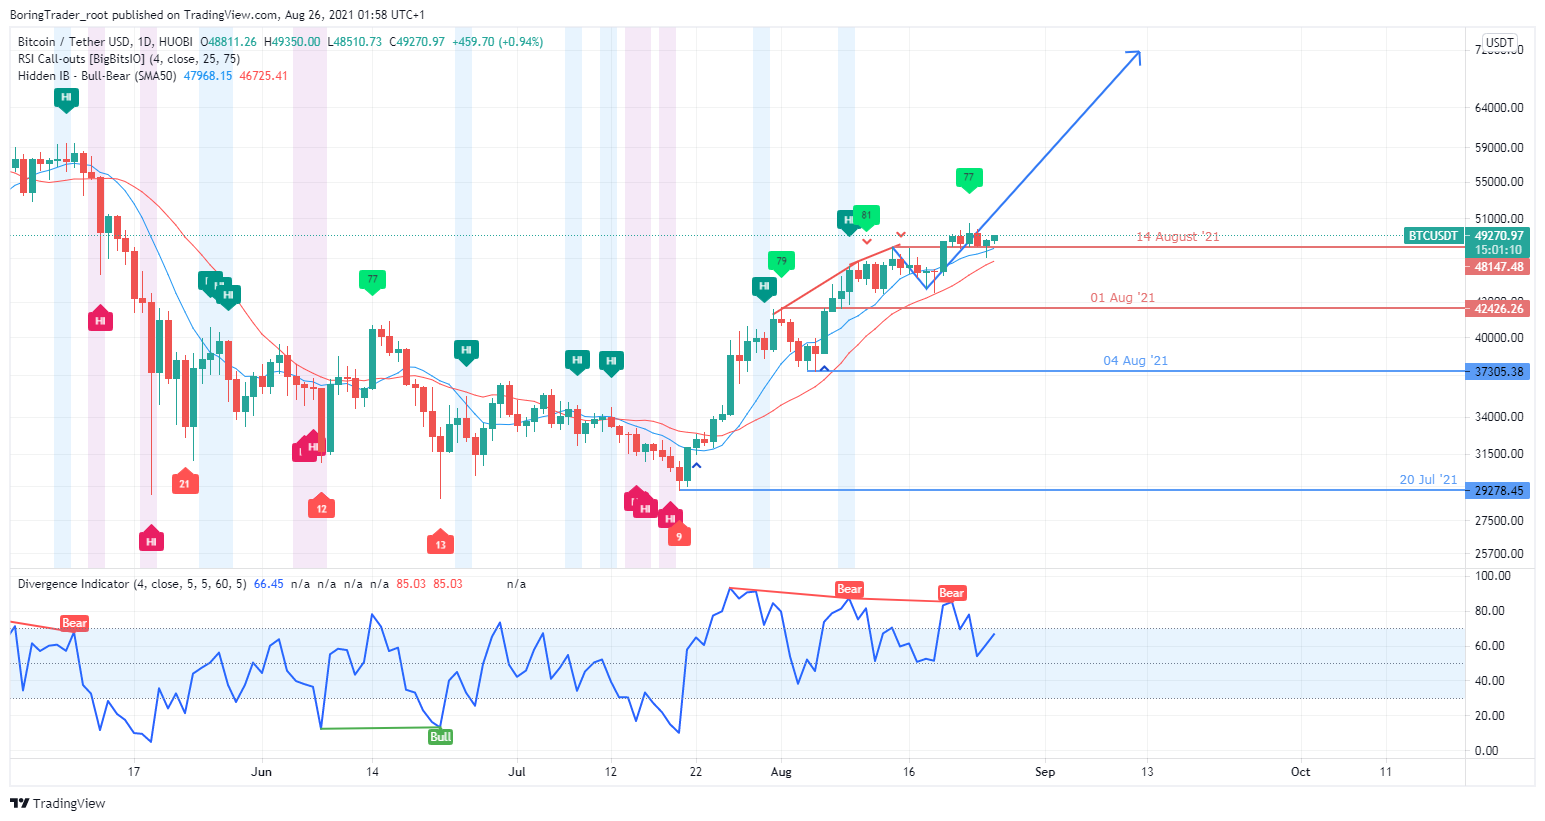
Daily Resistance 56000, 48327, 50576
Daily Support 29330, 37200, 42517
The Bitcoin price has been making a series of higher highs and higher lowers for some days and it’s an indicator of a healthy trend. For the online brokers, they should look for ways to be in an uptrend market as the market favors the buyers now.
The price needs to close above the recent high of 50576 for the bullish run to continue on the daily time frame. Should the bears push back price to close below the 42517 levels, we may see the BTCUSD pair drop to the low of 37200.
H4 Chart
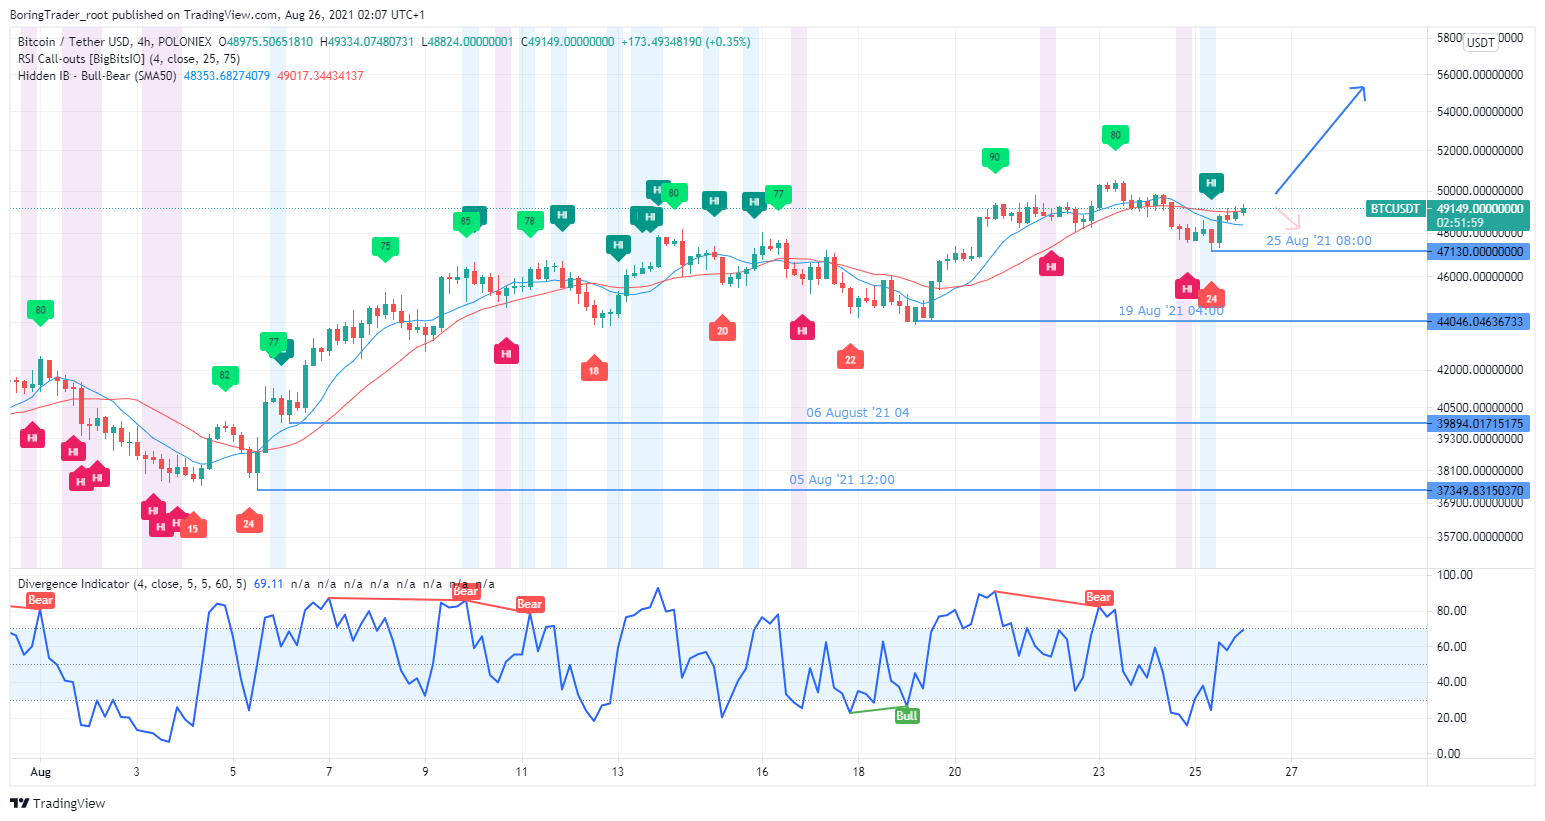
4 Hour Resistance 50560, 499841, 52000
4Hour Support 48189, 43978
From the 4-hour chart, we can see that the market structure has shown lower highs and lower lows showing a possible bearish trend if the price can close below the psychological zone of 48189 in the market, the support level. If the 499841 level should also reject price and close below the support level, we shall is a reversal pattern of head and shoulder on the four-hour time frame and it will lead price to the low of 43978.
However, if the sellers cannot close below the one of 48189 and the buyers close above the 50560 level, we shall see the buyers target the 52000 levels.
Bullish Scenario:
If the Buyer’s momentum overcomes some resistance levels and will still need to break above the current resistance it is facing before going higher. Looking at the daily chart, we can see the bulls are still controlling the market having taken out the 48189 zones. Online brokers may take the bitcoin price higher and higher for another long run rally from the low of the current price.
Bearish Scenario:
The 4hour time frame tells us that there are few market participants who are still bearish on BTCUSD on the time frame for a possible push below the support zone of 48189. A close below will take down the price to the zone of 43700.
Bitcoin BTC News Events
Kiyosaki Robert (Rich Dad, Poor Dad) View:
The author of the most influential books of our time on financial literacy markets and assets twitted his opinion about bitcoin as ‘’ the greatest upside’’ compared to other assets that allow for storing value and help protect funds and serve as an inflation hedge. From his Twitter account he said that Gold is stagnant, Sliver is under its all-time high with 50% while the dollar is falling but bitcoin is blossoming.
According to Robert, he feels that the Silver investment and bitcoin are the best for storing value. He expects another bigger crash to happen in the market where bitcoin might drop to the low of 24000 before buying the dip. The reason was because of the stimulus bill of 1.9 trillion dollars the congress approved in March making the biggest bubble bigger.
The Black Thursday of 2020 March was the period exchanges saw a significant amount of Bitcoin movement it was almost 845000 bitcoins and about 825000 went into cold wallets. According to the CryptoQuant analysis, about 843K bitcoin moved on to exchanges after 17 months. The analysts tweeted that the market is still experiencing an increase in the open interest while the fund rate remains low.
Conclusion and Projection
The Bulls have dominated the market in this recent period and it will interest the online brokers and other market participants to see how the number one coin will breakout above the current resistant levels it is facing because it will attract more participants because another ATH will likely be created.
Also, some school of thought thinks that a big crash is likely to take the price down from the zone before some whales buy from the dip around 23000 zones. However, the factors affecting the market will give the BTCUSD pair its actual direction.

I've been a professional trader for over 5 years.
Currently I work as forex analyst for different investment companies.
- EURUSDWeekly outlook – 7th January 2022 - January 7, 2022
- BTCUSD – Weekly outlook for Bitcoin Price – 23rd December 2021 - December 24, 2021
- USDSGDWeekly outlook for Singapore Dollar – 17th Dec 2021 - December 17, 2021
Tagged with: btcusd