BTCUSD Outlook & Technical Analysis for Bitcoin
Contents
Introduction
This month’s surge of BTC/USD is set to make a new high for the year 2020, and it will interest the best online trading brokers to see bitcoin close above 2019 high it will attract more buying opportunity into the market.
BTCUSD Technical Analysis
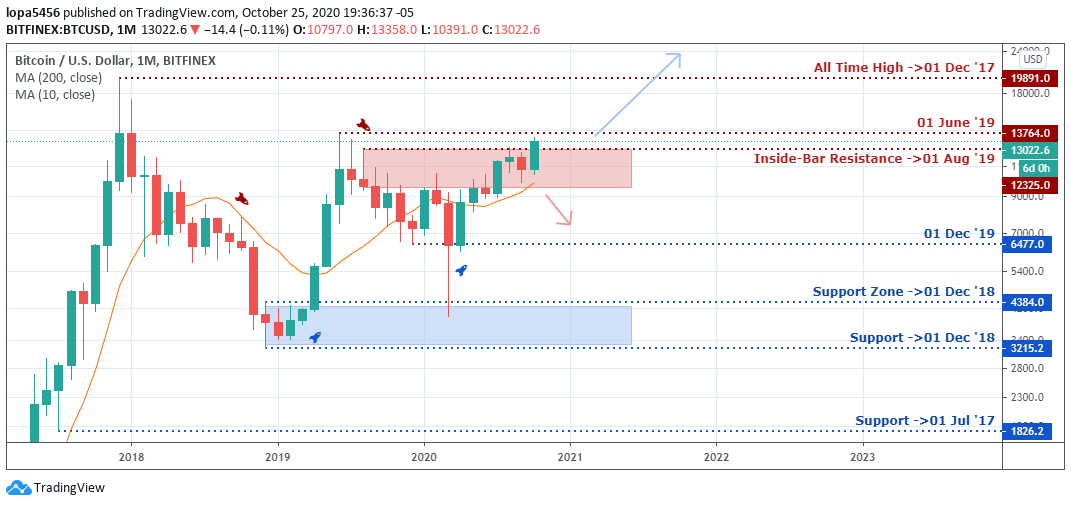
Monthly Chart
Monthly Resistances : 137640.0 19891.0
Monthly Supports: 43884.0, 6477.0
The BTC/USD pair surge may be due to the upcoming US election, leading the online brokers, investors to buy BTC as a haven because of the uncertainty of the election and how it affects the currencies.
From the look of things, we expect a close above the resistance zones of 137640, which will expose the next level of resistance, which is the 19891.0.
The resistance zones of June 2019 may spring a surprise if bitcoin’s price fails to go higher from that level, we may see the price drop down to (6477.0) the support levels of December 2019.
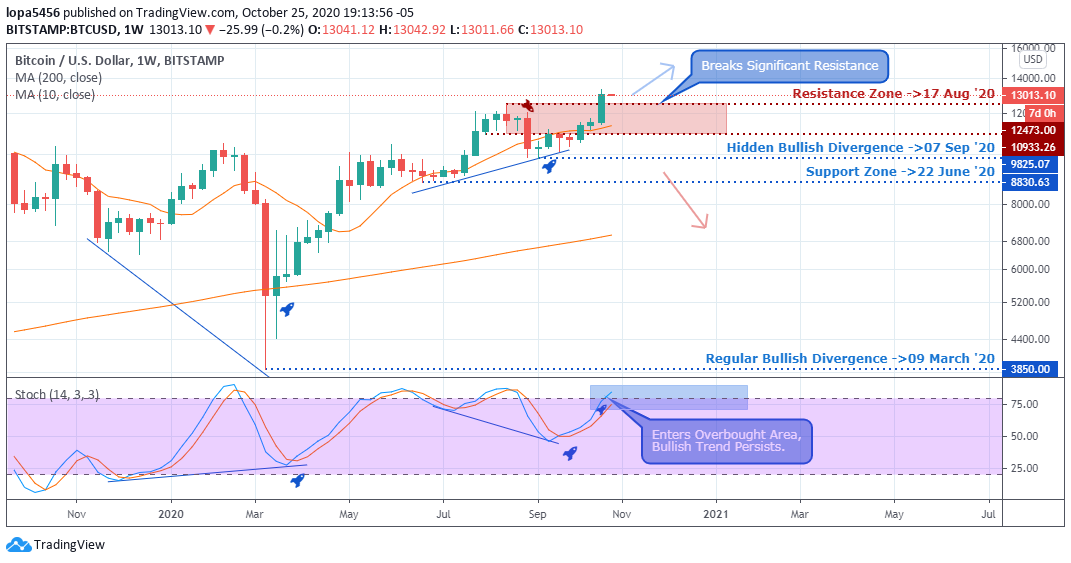
Weekly Chart
Weekly Resistance Levels: 12473.00, 13013.10
Weekly Support Levels: 9825.07, 3850.00, 8830.63
The previous weekly candle closed, showing bullish momentum above the resistance zone of 13013.10 of 17 August 2020, which will likely attract more buyers in the market. If the bullish move is sustained, we may see the trend rallying higher and higher.
The point of concern is the Stochastics indicating the bullish trend’s overbought area, which is an avenue for the bears to observe for a trend reversal from the resistance levels that will push the price down 9825.07 zones.
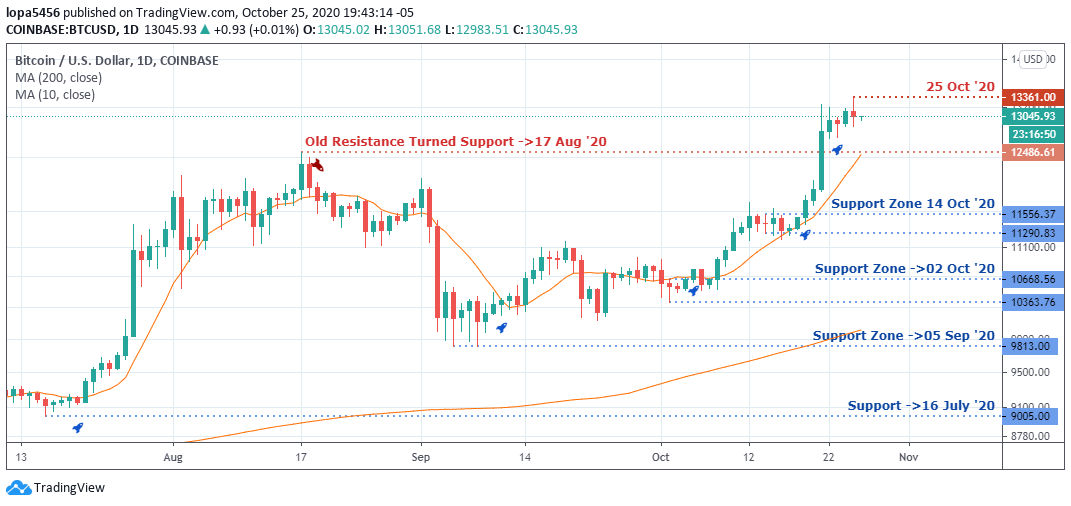
Daily Chart
Daily Support Levels: 11556.37, 10668.56, 9813.00, 11290.83
From the daily time frame, we can see a clear bullish trend that the BTCUSD has been riding for the past days right from the support of 9813.00 of 05 September 2020, which was able to close above the old resistance 12486.61 levels.
We can see a loss of momentum from the resistance level, which indicates that the price needs to retest the previous resistance turned support if the uptrend must continue.
However, the bears may push back the BTCUSD to close below the 12486.61 zones, which will mean that the breakout was not real, but a means to induce traders on the wrong side of the market for a possible loss.
A close below the 124866.61 will mean a total reversal of the uptrend, and the downtrend will push the price down to 11290.83 support levels.
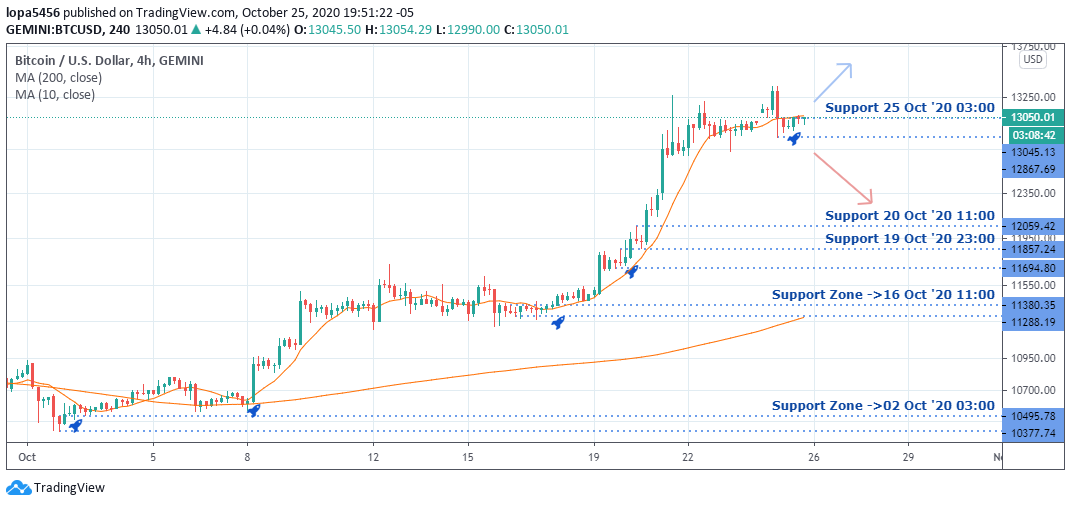
H4 Chart
H4 Resistance Levels: 13050.01, 13250.00, 13300
H4 Support Levels: 11857.24, 12059.42, 11380.35, 10495.78
The bulls dominated BTC/USD market, taking control of the low of 10495.78 with a rally to the high of 13250 as of 25 October 2020.
We expect the bulls to continue their trend as you can see the price of bitcoin closes above the resistance level, but if we know the price losing its momentum to close above the high, we may see a bearish swing to the low of 11857.24 from the resistance(13050.01) level.
Bullish Scenario:
A general bullish scenario based on the four-hour time frame and daily chart having going above a significant high. If the previous high can support the correction, we will see the bulls push higher from the low of 11857.24.
Bearish Scenario:
The resistance levels daily can be of interest to the online brokers because of the psychological zone, which is significant to the bears. If the Bears have enough force in the market, they can turn and reject the Bulls advancements from that level of 13361.0, which they have done.
Bitcoin BTC News Events
The year 2020 had to change the face world amid the COVID-19 pandemic, having experienced the shutting down of the global economy, forcing institutions, individuals, and groups to rethink how they do businesses.
During the period of uncertainties and turbulence, we saw bitcoin having a positive correlation with some assets since investors and Institutions see it as an alternative investment because some see it as a good correlation between bitcoin and traditional markets.
Some prominent institutions are into Bitcoin, having adopted it as a treasury reserve like MicroStrategy, who has acquired sizable bitcoin positions. At the same time, some organizations like PayPal introduced bitcoin into their platform. These moves are giving bitcoin the mainstream spotlight in the cryptocurrencies market.
The more acceptances the cryptocurrencies have in payment options to buy or sell, the better it is in value and utility.
Conclusion and Projection
Earlier this year, 2020, there was a liquidity crisis in the financial market amid the peak of coronavirus pandemic that led to global lockdown; bitcoin’s behavior during the crisis has attracted the interest of participants from other industries.
If the current level fails to support the bullish surge, we shall get a trend reversal from 13045.13. However, if the bullish momentum should continue, the price of BTC/USD will create a new high for the year by moving above the 13250 levels.

- EURUSDWeekly outlook – 7th January 2022 - January 7, 2022
- BTCUSD – Weekly outlook for Bitcoin Price – 23rd December 2021 - December 24, 2021
- USDSGDWeekly outlook for Singapore Dollar – 17th Dec 2021 - December 17, 2021
Tagged with: btcusd


