
BTCUSD Outlook & Technical Analysis for Bitcoin
Contents
Introduction
OlympTrade broker has diversified their investments into bitcoin as a long-term safe-haven in the asset class of cryptocurrencies.
Amid the COVID-19 crisis, the asset class has gained value compared to the fiat currencies that lost its value at the pandemic’s peak.
BTCUSD Technical Analysis
Monthly Chart

Monthly Resistance Levels: 19891.0, 13764.0, 12335.0,
Monthly Support Levels: 6477.0, 4334.0, 3215.2
BTCUSD bullish momentum is still strong mid-way of the month. The bitcoin brokers hope to see the surge close above the resistance levels of 12335.0 and 13764.0, respectively, having taken out the previous inside bar candle of 01 August 2019.
Over time, if the bulls can close above the resistance zones, we shall see bitcoin rise to the high of 01 December 2017 (19891.0).
However, if bitcoin fails to close above the resistance levels, Singapore brokers may see bitcoin drop back towards the support level of 6477.0 as of 01 December 2019, where the bulls surge started.
Weekly Chart

Weekly Resistance: 9312.00, 10500.00, 13880.00
Weekly Support: 3850.00, 7469.00, 8830.56, 9312.00, 10500.50, 10933.26
The weekly chart shows the dominance of the Bulls from the 09 March 2020 (3850.00) and 06 April 2020 (9312.00) support zones with a bullish run before hitting a resistance level of 10933.26 and closing above it after a minor pullback.
The bullish momentum was keen to take the price of bitcoin above the resistance levels and to turn the zone into support, having taking BTCUSD above the previous resistance of 22 June 2020 (10933.26).
If the buying pressure can be sustained, we may continue to see more investors and other institutions buy bitcoin in anticipation that it will rise to 13800.00 level.
As the price of bitcoin approaches the resistance zone of 13800.00 of 24 June 2019, Singapore brokers are to watch the behavior of the market around the level. The bear’s pressure may come to play around the zone, which may reject further advancement of bitcoin.
Daily Chart
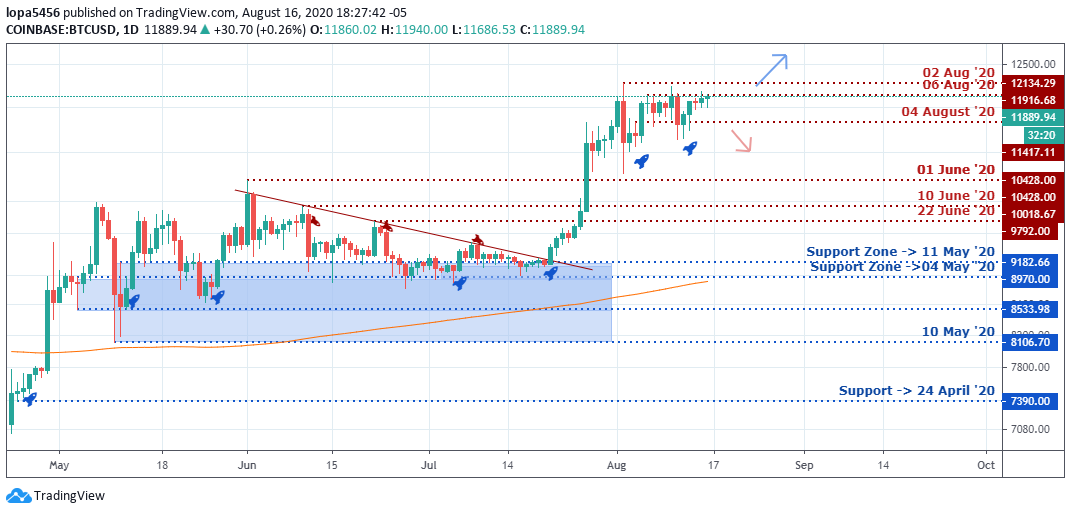
Daily Resistance
Levels: 12134.29, 11916.68, 10428.00
Daily Support Levels: 8106.70, 8553.98, 8970.00, 9182.66
The Bullish daily candle that broke right above the descending trend line around the support level of 9182.66 attracted buyers into the bitcoin market. It indicates a change in the direction of the price from a bearish trend to a bullish trend.
A close above a strong resistance point of 10428.00 has technically turned that level into a support level in the future. This breakout led the bitcoin price into another bullish run for some days.
However, since the bulls rally took the price up to 12134.29 as of 02 August 2020, the bullish momentum has dropped, and we can see signs of bearish candles rejecting the price of bitcoin at that level.
At these zones, we may see the bulls retesting the level for a possible breakout above for another swing higher, or we get another bearish sign rejecting bitcoin price to push it down to the 10428.00 level.
H4 Chart
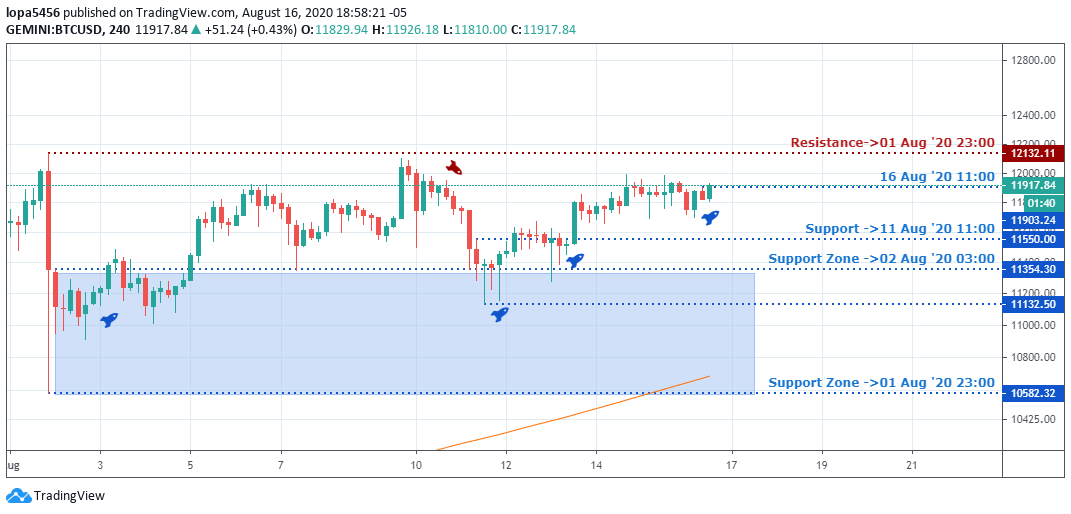
4 Hourly Resistance Level: 12,112.11
4 Hourly Support Levels: 10,532.32, 11,132.50, 11,354.30.
Looking at the H4 time frame, we can see that after the sharp rejection of bitcoin price from the 12112.11 zones, bitcoin went into a range rejecting the low of 10532.32 of 01 August 2020.
The bulls rally was established after the support levels of 11132.50 and 11354.30 pushed the bulls up. The surge is taking bitcoin’s price towards the resistance of 12112.11 as of the writing of this report.
If the surge is reliable, we may see the bulls move above the level, but if the momentum is weak, we shall see another rejection of bitcoin around the zone.
Bullish Scenario:
The daily time frame has been a bullish scenario since the swing started from the breakout level of 10428.00 up to the new resistance level of 12134.29 and 11986.68.
If we see a close above these levels, it would mean that the buyers are still in the market, and a new high is on the target.

I've been a professional trader for over 5 years.
Currently I work as forex analyst for different investment companies.
- EURUSDWeekly outlook – 7th January 2022 - January 7, 2022
- BTCUSD – Weekly outlook for Bitcoin Price – 23rd December 2021 - December 24, 2021
- USDSGDWeekly outlook for Singapore Dollar – 17th Dec 2021 - December 17, 2021