
BTC/USD Outlook & Technical Analysis for Bitcoin brokers
Contents
Introduction
At the last days of the month, we observe that the Bitcoin BTC price on major Bitcoin brokers have since declined by about 34.3% from last month high of $13880.0. It is about the longest price correction since the BTC broke above the $4265.0 resistance.
Let’s take a look at the technical price patterns, news and events that may be driving the BTC price.
Bitcoin: In the news
Bitcoin occupies 11th Place, in China’s Monthly Crypto Rankings
As per data published on July 31 by Forex Crunch, Chinese CCID Research Institute in its most recent rankings has placed Bitcoin (BTC) in the eleventh position on a list of 37 digital currencies considering its application, technology, and innovation.
The CCID Research Institute, which provides a periodic assessment of cryptocurrency projects, put together a total value index by assessing 37 cryptocurrencies.
They do this by considering such properties as its fundamental technology, applicability, and innovation.
In the latest release, top on the list is the EOS blockchain with a point’s total of 153.1. At second place is Ether (ETH) -148.6 points; the third, fourth, and fifth positions occupied by Tron (TRX), NULS (NULS), and blockchain project GXchain respectively.
Bitcoin, with a total of 103 points, is placed in the eleventh position in the assessment.
BTC/USD Technical Analysis
BTCUSD: Weekly Chart
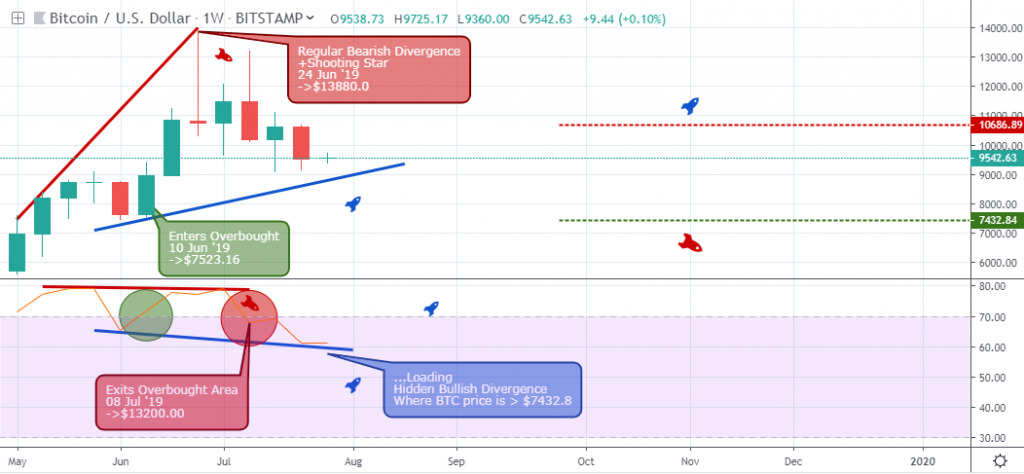
Divergence patterns are known for either signaling a change in trend which could be a retracement of an existing trend, or they could signal the continuation of an existing trend, such is the regular bearish divergence pattern signaled on 24 June ’19 alongside an inverted Pin-bar candlestick pattern.
The bearish signal led to an exit of the overbought territory on 08 July ’19, and the RSI oscillator currently makes a lower low compared to price making a higher low, therefore indicating a buildup of hidden bullish divergence perhaps in the coming week.
BTCUSD: Daily Chart
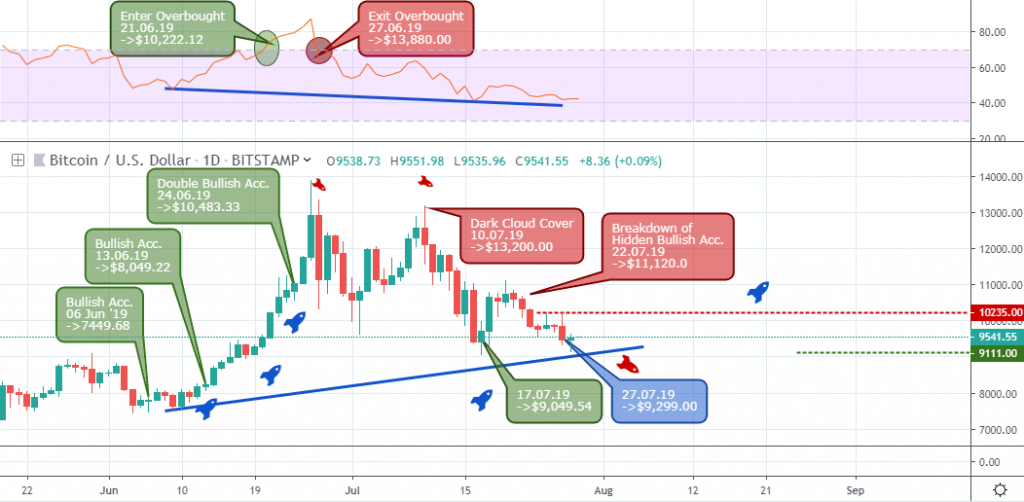
If you are familiar with harmonic patterns you’ll immediately notice a Gartley pattern formed after the established low of $9,049.54 on 17 July ’19. Other than the Gartley harmoninc pattern, a hidden bullish divergence pattern is still in view, even in the face of last week’s bearish swing.
BTCUSD: H2 Chart
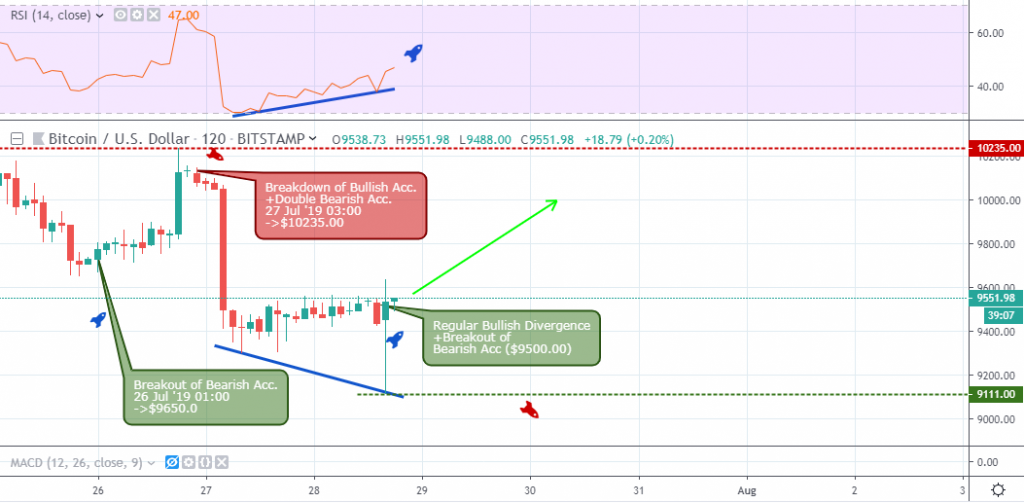
Last week 26 July ’19, the Bitcoin BTC price broke above the $9760.06 resistance increasing by about 4.5% before the bears increased the selling pressure and demand for the number one cryptocurrency by market-cap started drying up.
The breakdown of bullish accumulation, followed by double bearish divergence on 27 July ’19 signaled the increase an increase in BTC supply, for a counter 9.6% price drop.
A hidden regular bullish divergence pattern signaled at press time points to an increase in buying power as well as rejection of bearish resistance.
Conclusion and Projection
Following recent breaks above bullish resistance levels on 28 July ’19 03:00 and on 30 July ’19 19:00, the Bitcoin price appears to be coming out of the five weeks price retracement as the bulls push the exchange rate higher on major Singapore broker platforms.
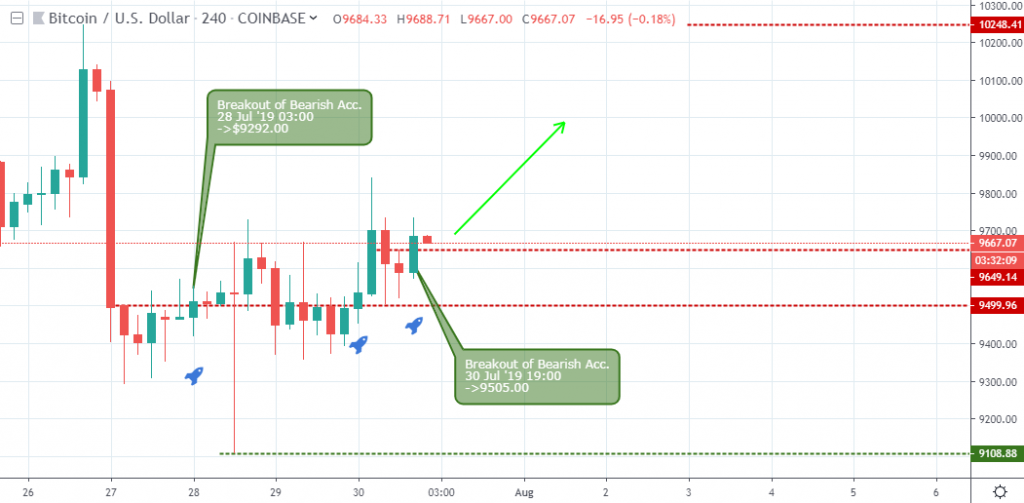
Prior to publishing this post, our price objective of $100248.41 is already achieved, as the BTC breaks above the MA-65.
We expect a continuation of the Bitcoin to dollar bullish trend as we enter a new month.

I've been a professional trader for over 5 years.
Currently I work as forex analyst for different investment companies.
- EURUSDWeekly outlook – 7th January 2022 - January 7, 2022
- BTCUSD – Weekly outlook for Bitcoin Price – 23rd December 2021 - December 24, 2021
- USDSGDWeekly outlook for Singapore Dollar – 17th Dec 2021 - December 17, 2021