
BTCUSD Outlook & Technical Analysis for Bitcoin
Contents
Introduction
This week, we’ll not only be looking at the technical price levels on the Bitcoin BTC charts, we’ll also start by comparing the Miner’s revenue chart to the BTCUSD chart on a weekly time frame, and see how it drives the BTC price on IQ Option broker
We’ll also touch on a major news event that may be a significant catalyst for driving the BTC price.
A comparison of Miner’s Revenue to the BTCUSD: Weekly Chart

The Miner’s revenue MIREV chart has been a fundamental driver of the Bitcoin BTC price, considering that miners represent the Central Bank in a traditional market sense.
An increase in Miner’s revenue would incentivize Miner’s to hold on to their Bitcoin BTC stash. However, if the Miner’s revenue starts to dry up, miners no longer have an incentive to hold on to their positions, consequently leading to a bearish trend on the Bitcoin to dollar chart.
After establishing a high (28.5B) and signaling an accumulation of bullish pattern on Jul 01 ’19, the Miner’s revenue started a bearish descent for about 45.95% in twenty-six weeks.
The recent regular bullish divergence of the stochastic oscillator on the MIREV weekly chart shows that we should expect a recovery in the price of Bitcoin BTC going forward into Q1 2020.
Let’s move on to analyze the technical charts of the BTCUSD following a typical top-down analysis.
BTCUSD – Technical Analysis
Weekly Chart
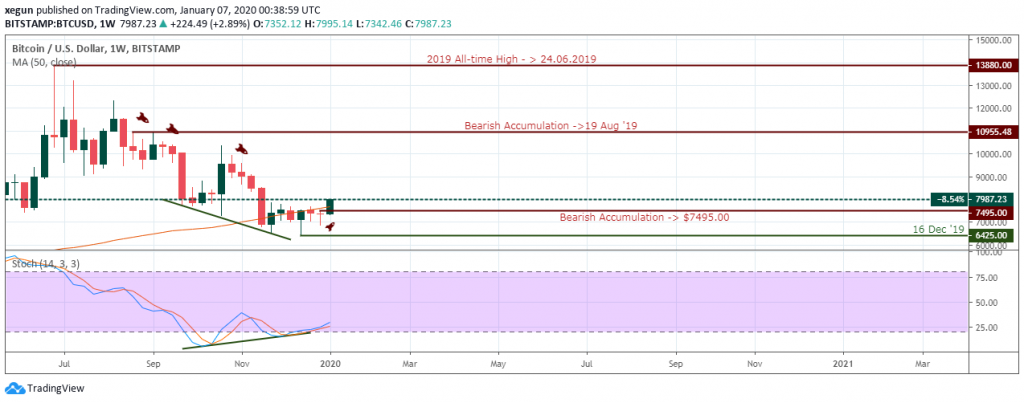
Bitcoin BTC from the weekly time frame signals a regular bullish divergence on the weekly time frame, at the same time, threatens to close above the $7495.00 bearish accumulation resistance.
The market shows a strong bullish outlook on this time horizon, and it may mark an end to the six months bearish price slump.
Daily Chart
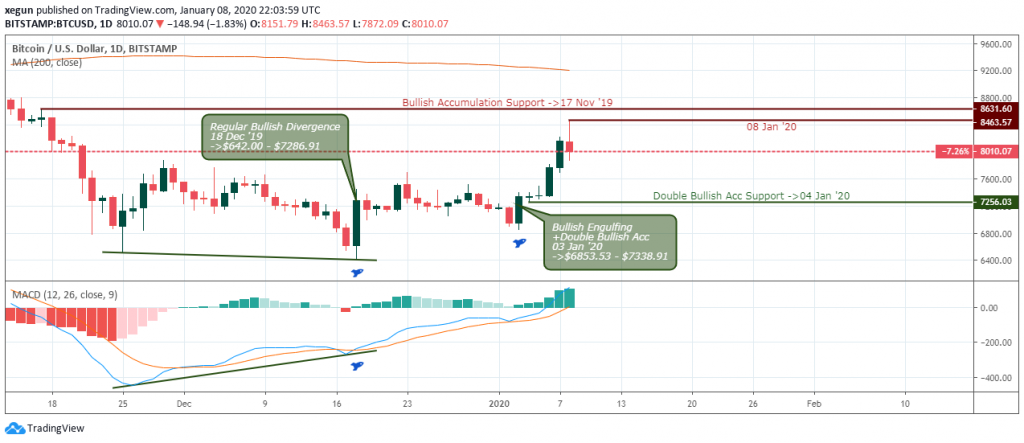
Similar to the weekly time frame, the daily chart signals a regular bullish divergence. However, unlike the weekly time frame where a stochastic oscillator is used for the divergence pattern, here, the MACD oscillator sets the divergence levels.
The divergence pattern sets a support level at $642.00, then later went on to signal a bullish engulfing and bullish accumulation pattern at $6853.53 and $7256.03 on Jan 03 and 04 ’20.
4Hour Chart
Let’s round up our analysis on the 4hour chart where the pair signals a breakout of resistance on Jan 03 ’20 04:00 and moving for about +17.7%.
The hidden bullish accumulation pattern on Jan 08 ’20 hints on possible exhaustion of the bullish trend, which finally collapsed at press time for about 8.0%.
Bitcoin Fundamentals
Iran’s Attack on U.S. Bases in Iraq Affecting the price of Bitcoin
The ongoing dispute between the U.S. and Iran is having a positive effect on BTC price, observers note.
Following the rising tensions between the two nations, the price of Bitcoin has taken an upward trend hitting $8,450 on Tuesday, Jan 07. To illustrate this fact, observers have noted that the most recent push which saw the price of Bitcoin climb above $8,500 occurred as the report of Iran’s attack on United States troops stationed at two military bases in Iraq circulated.
Tuesday’s push in price saw Bitcoin push above the 200-day moving average for the first time since November 2019.
Conclusion and Projection
The above analysis shows that we should expect an end to the correction phase in Bitcoin BTC price on major Singapore broker platforms if the analyzed resistance levels are breached.

I've been a professional trader for over 5 years.
Currently I work as forex analyst for different investment companies.
- EURUSDWeekly outlook – 7th January 2022 - January 7, 2022
- BTCUSD – Weekly outlook for Bitcoin Price – 23rd December 2021 - December 24, 2021
- USDSGDWeekly outlook for Singapore Dollar – 17th Dec 2021 - December 17, 2021