
BTCUSD Outlook & Technical Analysis for Bitcoin
Contents
Introduction
The Covid-19 pandemic second wave is of concern for OlympTrade broker and other platforms. A steady increase in the number of new cases will hinder the investment plans of every bitcoin broker.
BTCUSD Technical Analysis
Monthly Chart

Monthly Resistance Levels: 196664.00, 13880.00
Monthly Support Levels: 152.40, 211.25, 262.85, 3122.28, 4265.00,
The Moving Average has been dynamic support in the buildup of the BTCUSD uptrend right from 2015. 2018 Bitcoin found resistance at 19666.00 before it corrected to the support zone of 3122.28.
The rejection of price at the support level of 4265.00 and 3122.28 zones confirm an uptrend bias in the market. Those with long position opened will want to see price close above the 13550.00 marks.
Weekly Chart

Resistance: 10429.26, 9135.68
Support: 3850.00, 4435.89, 7469.00, 8630.00, 9135.68
In the past eight weeks, the bitcoin price has been ranging between the 10429.26 and 9134.95 levels. It has been choppy and has been around moving very close to the price, which has made bitcoin choppy in recent times.
At the moment, the resistance level of 10429.26 prevents the BTCUSD from going up above the zone. This is a psychological zone in the bitcoin market.
If the bitcoin price closes below the moving average, we will likely get a selling pressure pushing the price to the support area of 8630.00 that considers a previous resistance level (30 December 2019) that has turned to support level (06 April 2020).
Daily Chart
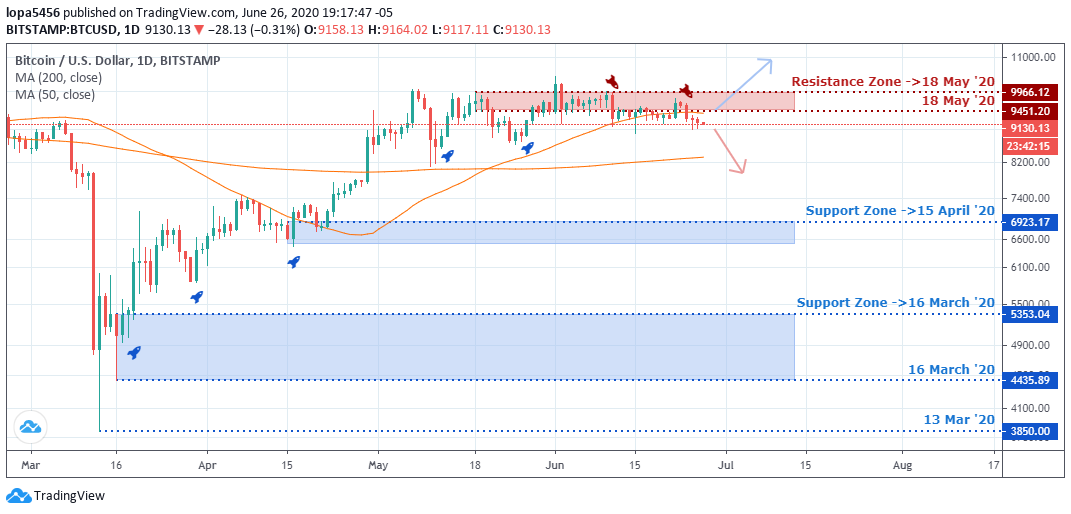
Resistance: 9666.12, 9451.20,
Support: 3850.00, 4435.89, 5353.04, 6923.17
After days of the choppy movement, we can see bitcoin price struggling around the resistance zones of 966.12 and 9451.20. The earlier bullish run has not been able to close above the psychological zone of bitcoin. A close above will expose BTCUSD to a new level.
The resistance zone is a psychological level that sellers see as an opportunity for them to push back the price to a significant area of support like 6923.17 if they (sellers) can take over the market, and investors await a clear direction.
H4 Chart
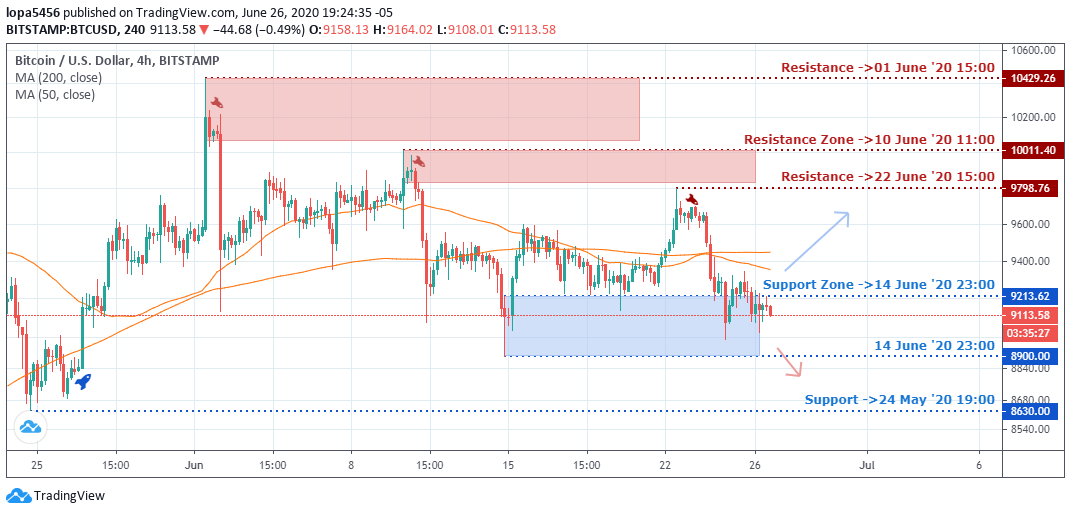
Resistance: 10429.26, 10011.40, 9798.76,
Support: 8630.00, 8700.00, 9213.62
The strong spike from the resistance levels of 1029.76, 10011.40 and 9798.76 shows that traders are placing sell orders around the zones because they believe that the price will go down from the zone.
Currently, BTC has found support around the 9211.62, 8700.00, and 8630.00, and it is in a range between the resistance level and support levels.
Bullish Scenario:
A close above the psychological zone on the daily chart will bring in more buyers into the market into the general bullish scenario based on the time frames.
Bearish Scenario:
On the smaller timeframe like H4, we expect a short downward trend in our bearish scenario towards the support zone of 8630.00.
Bitcoin BTC News Events
The Singapore broker operators are watching the bitcoin reaction as June is folding up gradually. The recent news published by the Singaporean government revealed that there were ransomware attacks in 2019. The Cyber Security Agency of Singapore disclosed it, and about 35 cases were reported.
Most victims were tourists, manufacturing industries and logistics, and travel agencies.
Terence Zou CEO and founder of Singapore carpooling app Ryde launched his cryptocurrency wallets, which will facilitate bitcoin payments for its service.
His payment plan will also allow users to convert BTC to Ryde coins with no charges and are pegged on the value of the Singaporean dollar. He sees this COVID-19 pandemic has a catalyst for the adaption of cryptocurrencies.
Conclusion and Projection
Bitcoin can have a minor correction before a push to close above the resistance on the daily tie frame.
Bitcoin brokers can see that the price of the BTC has been in consolidation for a while from the daily chart it’s been moving in a range for days. However, the cryptocurrency market cap stands at $258.9billion, and Bitcoin still dominates the market at 64.9%.

I've been a professional trader for over 5 years.
Currently I work as forex analyst for different investment companies.
- EURUSDWeekly outlook – 7th January 2022 - January 7, 2022
- BTCUSD – Weekly outlook for Bitcoin Price – 23rd December 2021 - December 24, 2021
- USDSGDWeekly outlook for Singapore Dollar – 17th Dec 2021 - December 17, 2021