BTCUSD Outlook & Technical Analysis for Bitcoin
Contents
Introduction
The dynamic nature of the world’s global economy has changed due to the effect of the COVID-19; the current circumstances happening around the globe have made IQ Option broker and investors rethink their approach to diversify their portfolios.
BTCUSD: Technical Analysis
Monthly Chart
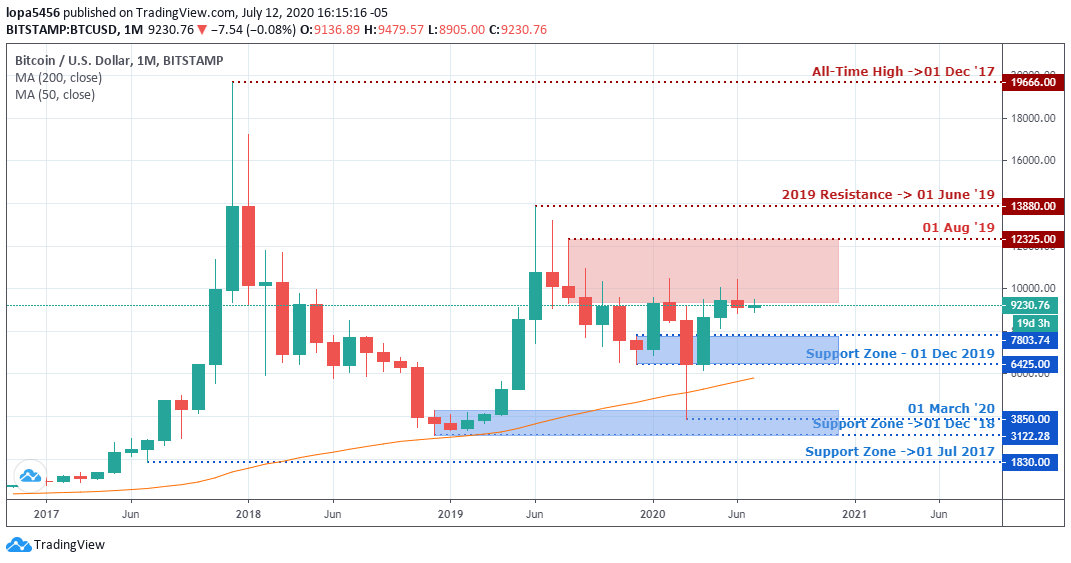
Resistance Levels: 19666.00, 113880.00, 12325.00
Support Levels: 1830.00, 3122.28, 3850.00, 425.00, 7803.74
The Bears have been in control of the bitcoin market on the monthly time frame since the rejection of the bullish surge on December 01, 2017. You can see that the swing highs are getting lower after the bull’s swing.
The Singapore brokers observe the performance of bitcoin in the coming months since the market has not been settled because of the COVID-19 pandemic. In recent times we have seen a sharp drop in price before correction of the swing.
The bitcoin price is facing stiff resistance, and there are possibilities that the bulls surge will soon fall out unless a strong event turns things around in the bitcoin market.
Weekly Chart
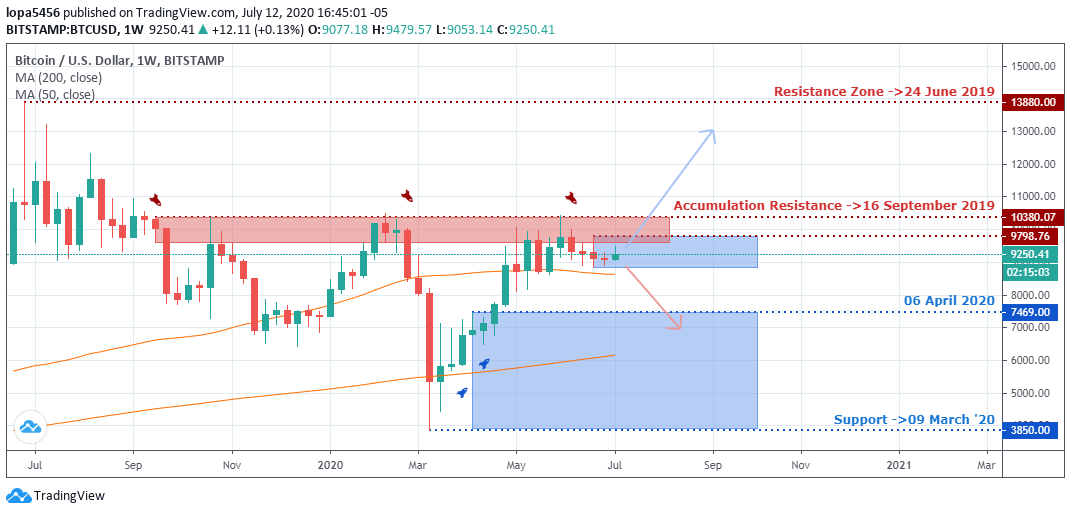
Resistance levels: 9798.76, 10380.07, 13880.00
Support levels: 3850.00, 7469.00
After weeks of bullish surge from the support level of 3850.00 on March 09, 2020, a strong resistance was met by the bitcoin price since September 16, 2019.
If the bulls cannot overturn that zone into support, we will see a rejection of the uptrend’s upside.
In the coming weeks, we shall expect a bearish bias should the bears push back the bulls’ advancement from the resistance level of the16th September 2019 (10380.07)
Daily Chart
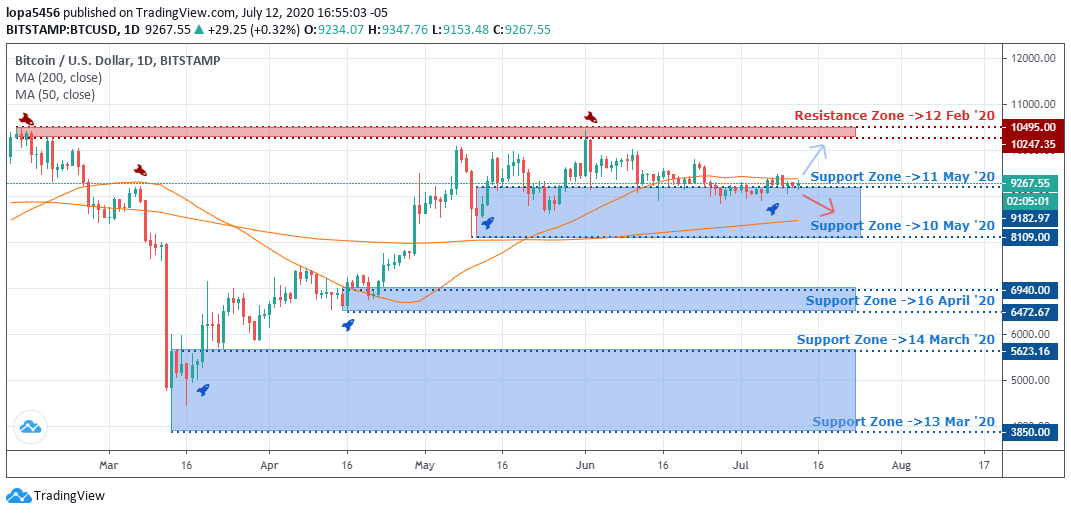
Resistance levels: 10247.35, 10495.00
Support levels: 3850.00, 5623.16, 6472.67, 6940.00, 8109.00, 9182.97
The BTCUSD price found support at the 3850.00 on May 13, 2020, and the Bulls were able to take the price up to 10495.00 before it met resistance at the zone.
The bitcoin market has been ranging between 10495.00 and 8109.00 price area, a breakout below the support or above the resistance will be of significant interest to the Singapore broker service providers.
After days of an upward trend in the bitcoin market, the bullish momentum has quiet down, and there is a possibility of the bears pushing back price to the 8109.00 support level of May 10, 2020.
H4 Chart
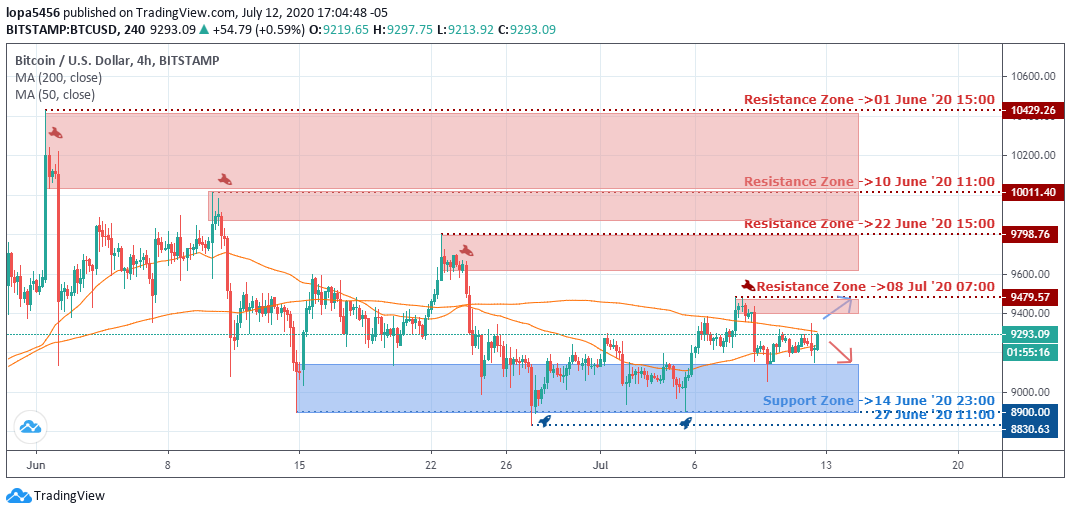
Resistance: 9479.57, 9798.76, 10011.40, 10429.26
Support: 8830.63, 8900.00
A descending triangle chart pattern is formed on the H4 time frame, and there are two possible options in this scenario.
- We can get a breakout to the upside.
- We can get a breakout below the support level for a bearish trend.
At the time of writing this report, you can see from the above chart that the resistance has been dropping down consistently after every upward surge of the bulls while the support level has been at the same level.
From the recent resistance zone of 9479.57 of July 08, 2020, we can see the bears pushing down the bitcoin price to the 8900.00 support level. If the pressure continues, the bears may overturn that level of support into a resistance zone if the bears can close below the zone.
Bullish Scenario:
The Bulls are likely to take back the bitcoin market weekly if they can overturn the resistance level into support by breaking above with a strong candlestick that closes above the zone.
Bearish Scenario:
The H4 may be an early sign of the bearish sentiment in the bitcoin market. The price of bitcoin is in the supply zone, where sellers have place orders for short positions.
Should the Bears turn the support level of 8100 into resistance on the daily timeframe, we will likely get more of the sellers in the market?
Bitcoin BTC News Events
The aftereffect of the COVID-19 in the global economy has forced organizations, institutions, and other multinationals to diversify their investment portfolios.
Bitcoin has been one of the most traded options among exchanges such as the Binance and Chicago Mercantile Exchange, which has aided the growth of the crypto derivatives market this year 2020.
There is a sign of Institutional interest in the crypto market because, during the COVID-19 pandemic and the global financial crisis, bitcoin options volume on CME set a new record high jumping from 41% with 8,444 contracts traded in June about $393 billion.
Conclusion and Projection
Institutional traders are becoming interested in bitcoin because it serves as a hedge with a sophisticated derivatives market and option trading.
The psychological zone of the market is within the 10495.00 resistance and 8109.00 support.

- EURUSDWeekly outlook – 7th January 2022 - January 7, 2022
- BTCUSD – Weekly outlook for Bitcoin Price – 23rd December 2021 - December 24, 2021
- USDSGDWeekly outlook for Singapore Dollar – 17th Dec 2021 - December 17, 2021


