
BTCUSD Outlook & Technical Analysis for Bitcoin brokers
Contents
Introduction
Last week, the US President publicly criticized Bitcoin BTC, Facebook’s Libra and cryptocurrencies at large, saying that their value is mainly speculative and are generated out of thin air. The event sent a negative effect across the cryptocurrency market, with the total crypto market-cap seeing a 20% decline in about four days on bitcoin brokers platforms.
Bitcoin: In the news
Following an error in Bitpoint’s outgoing funds’ transfer system, the exchange immediately suspended its services on 12 July ’19.
Not too long after the suspension in service, an announcement was made for a loss of about 3.5 billion Yen, resulting from a breach in security. The exchange has found parts of the missing funds after the first announcement.
According to a Bloomberg report, the company’s shares dropped by 19%, and an avalanche of sell orders made the untradable in Tokyo after the news release.
In a report by Mainichi a local publication, the exchange Bitpoint has found over 250 million Yen worth cryptocurrency.
Below is a breakdown of the loss by cryptocurrency:-
Bitcoin BTC 1,225; Ripple XRP 28 million; Ether ETH 11,169; Bitcoin Cash BCH 1,985; and Litecoin LTC 5,108.
CEO and founder of Bitpoint mentioned plans to compensate depositors.
BTCUSD Technical Analysis
BTCUSD: Weekly Chart

Starting from the weekly time frame, a shooting star candlestick pattern on June 24 ’19 confirms a regular bearish divergence on the weekly time frame, and consequently, the current price decline observed on major Singapore broker platforms.
Going forward, a hidden bullish divergence pattern is anticipated confirming the current decline as a retracement, as long as the Bitcoin BTC price does not go below the 7432.84 USD Support.
BTCUSD: Daily Chart

The dark cloud cover candlestick pattern on July 10 set the Bitcoin price rolling in a bearish trend about two days before criticisms by the US President. Further increase in selling pressure from the negative comments by the US leader forced the price below a critical support level of $10572.0, which has been established since June 24.
BTCUSD: H4 Chart

After another 13.23% price decline from bullish support on July 16, the Bitcoin price on major Singapore broker platforms quickly rushed out of the oversold territory and established bullish support at the eleventh and twenty-third hour of July 17.
Our anticipated breakdown of bullish support did not hold; however, the price closed in the bullish direction above the $10000.00 round number resistance, leaving the above bearish decline as a long lower candlestick shadow.
BTCUSD: H1 Chart
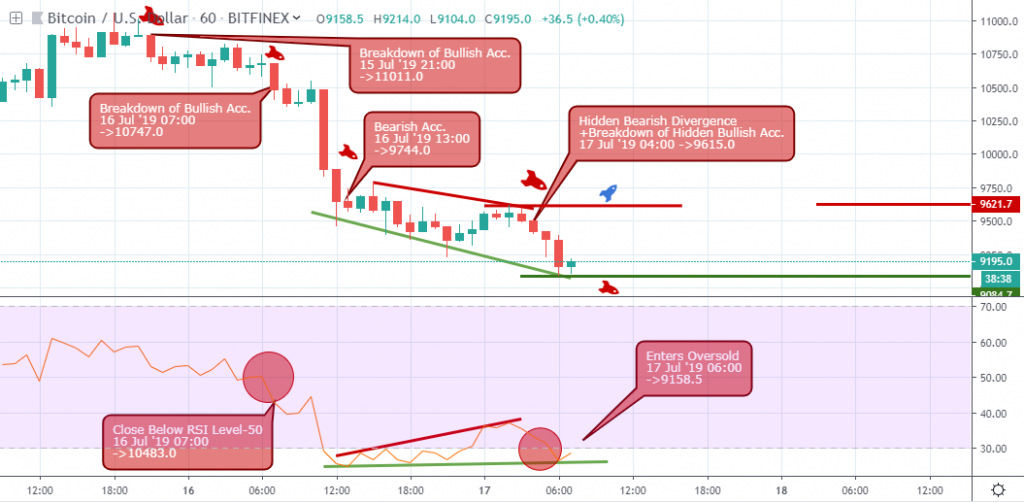
Finally, zooming way down to the intraday 1hour time frame shows the BTCUSD trading within a descending channel from opposing bearish and bullish divergence patterns, after a sequence of failed bullish supports on July 15 and July 16.
Exiting the oversold area, the sentiments switched from bearish to bullish as the demand for the BTC increased on July 18 ’19 13:00 by roughly 10% within an hour.
Conclusion and Projection
Using the previous May 27 ’19 resistance of $9109.0 on the weekly time frame as a springboard, the Bitcoin BTC price sets a low at $9084.7 and shoots back into the upward direction during the week.
With the total cryptocurrency market capitalization increasing by 19%, the market appears to have absorbed the bearish pressure, and we should look forward to a bullish closing month.

I've been a professional trader for over 5 years.
Currently I work as forex analyst for different investment companies.
- EURUSDWeekly outlook – 7th January 2022 - January 7, 2022
- BTCUSD – Weekly outlook for Bitcoin Price – 23rd December 2021 - December 24, 2021
- USDSGDWeekly outlook for Singapore Dollar – 17th Dec 2021 - December 17, 2021
Tagged with: btcusd