
BTCUSD Outlook & Technical Analysis
Contents
Introduction
This week comes packed with positive news for the BTC among such is a prediction by Brian Tracy that the next halving of the Bitcoin supply will result in an upward surge in the price. Mark Yusko, CEO of Morgan Creek Capital, has an opinion that the Bitcoin price may beat that of the S&P 500 ten years from now.
Read on as we take a look at the technical price patterns supporting this fundamental news.
Bitcoin Fundamentals
Bitcoin: In the news
Brian Kelly’s Prediction: The coming Bitcoin Supply Cut will increase Demand and Price
In an interview with CNBC.com on 21 May 2019, Brian Kelly, a crypto fund manager, stated that the next halving of Bitcoin in 2020 would result in a cut in mining reward into two.
Mr Kelly further stated that the hoarding of Bitcoin by miners in combination with increasing retail use and industrial adoption would result in rising Bitcoin price.
Technical Analysis
BTCUSD: Weekly Chart

December 17 ’18 was an important date in the cryptocurrency market as the bitcoin price, and other altcoin prices come out of oversold, signalling an end to last year’s fourteen months bearish descent.
The cross above the level-30 of the Relative Strength Index coincides with a break out of selling resistance on the same date, fueling the price increase above the level-50 and further into the overbought area (Level-70) on May 06 ‘19.
BTCUSD: Daily Chart

From the daily chart of major bitcoin broker platforms, the BTCUSD enters overbought, and the bullish pressure persisted further forcing the price above bearish resistance on 08 May 2019.
Following a collapse of buying pressure on 17 May 2019, the price leaves the overbought area as buyers take out profits from the market.
The pair later breaks above bearish accumulation resistance on 19 May ’19 setting up support at $6999.9.
At press time, the pair signalled a bullish Fakey price pattern that aligns with the RSI hidden divergence on 24 May ’19, as the bitcoin price threatens to break above the 8352.3 resistance.
BTCUSD: H4 Chart

On 08 May ’19 03:00 the BTCUSD breaks above selling resistance forcing the pair into the overbought area, similar to the daily time frame.
Formation of regular bearish divergence on 14 and 16 May ’19 serves as exits for long positions.
A combination of sell pressure in the form of bearish accumulation and regular bearish divergence forced the price to nosedive by about 10.77%, before signalling an opposite breakout of selling resistance on 18 May ’19 07:00, setting support at $6999.9, and $7207.6.
BTCUSD: H1 Chart
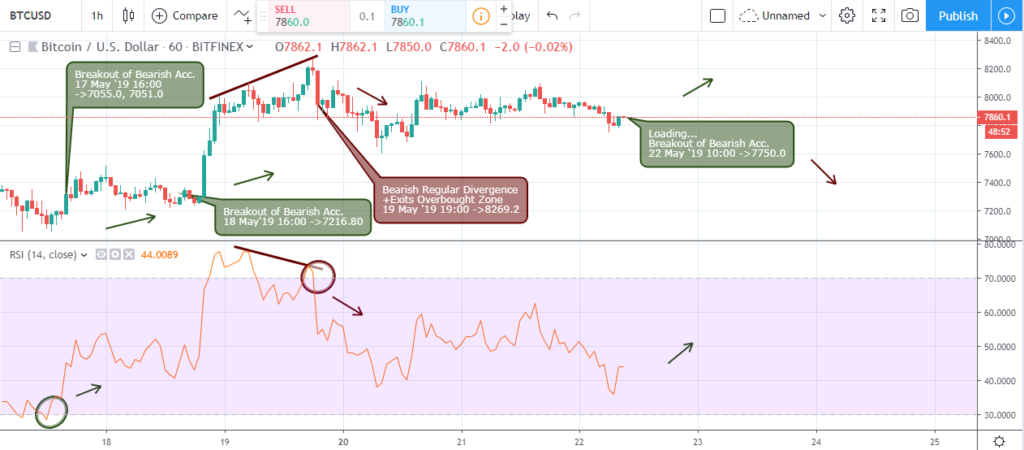
Lastly, the 1hour intraday chart comes out of oversold on 17 May 2019 16:00 establishing sound supports at $7055.0 and $7051.0.
The bears couldn’t sustain their positions as the bullish pressure overwhelm the resistance levels on 18 May ’19 16:00 for a 12.5% price surge.
Regular bearish divergence setup signaled on 19 May ’19 forced the bitcoin price out of oversold, ranged for about three days before the price plummets by 6.4%.
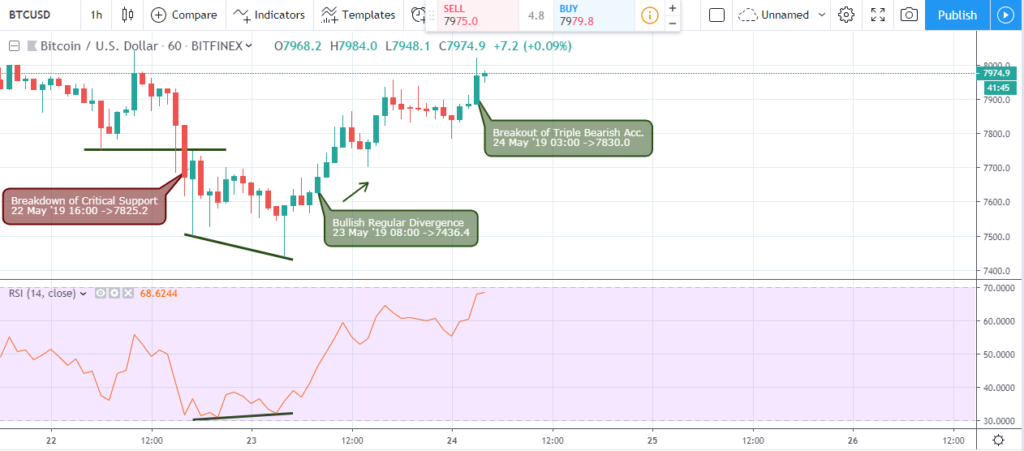
Recently, on 23 May ’19 08:00 the BTCUSD after hovering above the RSI level-30, signals an opposite regular bullish divergence pattern, which forced the pair into a bullish rally.
Conclusion and Projection
After establishing resistance at the $8352.3, the bitcoin daily price chart on Bitcoin brokers hows take profit activities of Bulls. If the overbought level is sustained on the weekly time frame, then the Bitcoin price has chances of advancing towards the $10,000.00 round number.

I've been a professional trader for over 5 years.
Currently I work as forex analyst for different investment companies.
- EURUSDWeekly outlook – 7th January 2022 - January 7, 2022
- BTCUSD – Weekly outlook for Bitcoin Price – 23rd December 2021 - December 24, 2021
- USDSGDWeekly outlook for Singapore Dollar – 17th Dec 2021 - December 17, 2021
Tagged with: btcusd