
BTCUSD Outlook & Technical Analysis for Bitcoin
Contents
Introduction
In the words of Warren Buffet, be greedy when others are fearful and fearful when others are greedy. Well, the number one cryptocurrency on IQoption broker is experiencing a considerable selling frenzy as fear of further lows hit the market.
Will the price attain the $5500.00 level projected by Bitcoin bull, Peter Brandt, or will it stall any time soon? Let’s go on to see what the technical charts look like and touch on some interesting news events in the space.
Bitcoin: In the news
ACINQ Publish its ‘Second Generation’ Bitcoin BTC Lightning Network Wallet
ACINQ has announced its second-generation Lightning Network wallet dubbed Phoenix.
The French Bitcoin (BTC) Lightning Network (LN) implementation developer in an October 18th Tweet posted a video showing how the wallet works. The footage revealed several wallet functions, all accessed through a user-friendly interface.
The wallet app, which can be installed on any Android device, is easy to set up with just a single click. The new app can also produce Lighting Network invoices and receive funds despite not having any open channels.
On offer on the app is the ability of the app to set up a payment channel on-the-fly for a set fee on receipt of an incoming transaction.
As soon as the wallet is funded, LN payments can be made by scanning QR invoices and clicking ‘pay’.
BTCUSD Long term Projection: Bullish Correction Phase
BTC/USD Technical Analysis
Monthly Chart

An increase in selling pressure on August 26 and September 16 was all it took to set the Bitcoin to dollar exchange rate in a downward spiral. Bullish momentum encountered resistance at $10955.48, $10380.07, and $8531.25, respectively. Failure to close above the resent $8531.25 resulted in a price plummet of about 11% from this week’s opening price.
We notice a slow in bearish momentum as the price approach the MA-50 on major Singapore broker trade terminals.
BTCUSD Medium Term Projections: Bearish
Daily Chart

Today October 23 ’19, the BTCUSD finally breaks below the three weeks old sideways market by roughly 8%. A move that causes a lot of novice day traders to start entering irrational short positions.
H4 Chart
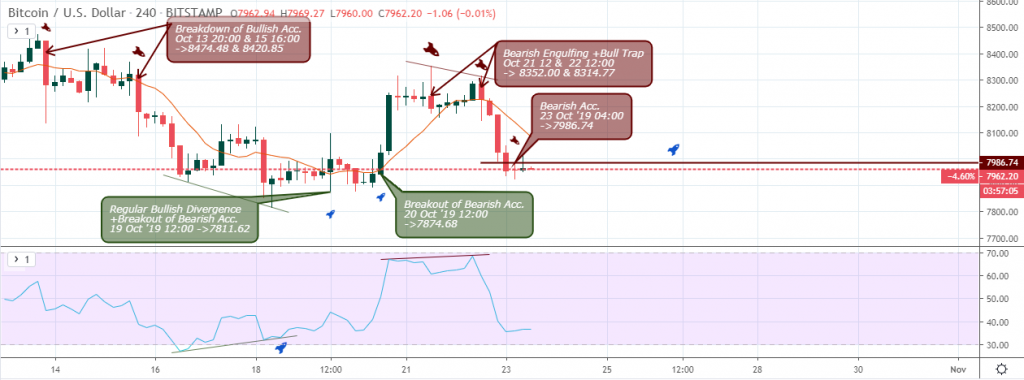
A view from the 4hour time frame shows how the bears completely dominate the bulls, by breaking below weak support levels on October 13 and 15. The regular bearish divergence on October 21 opposed the regular bullish divergence of October 19.
Bearish resistance signal on October 23 ($7986.74), forced the recent price plunge at press time earlier today.
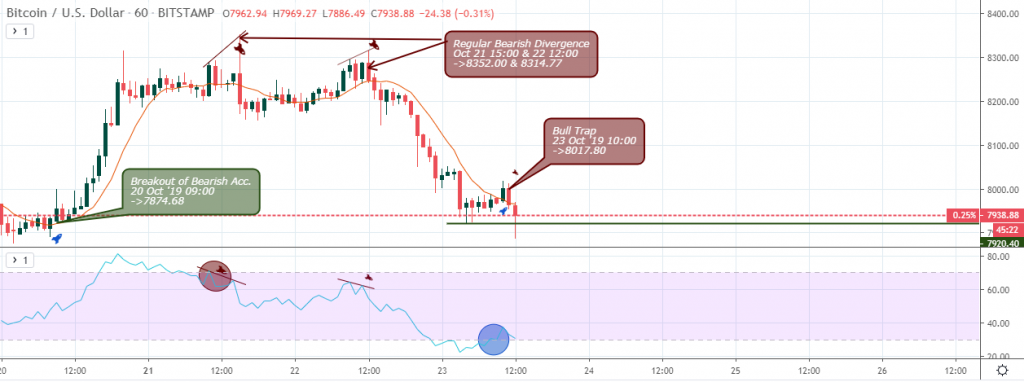
Finally, rounding up with the intraday 1hour time frame, regular bearish divergence patterns on October 21 and 22 setups sound resistance levels that were impregnable by bullish momentum. The price eventually slumped by roughly 11.5% from the divergence pattern and into the oversold territory.
Conclusion and Projection
With such a sharp increase in bearish momentum, lookout for an opportunity to enter long in the opposite direction. A MACD regular bullish divergence on the daily chart may be such a chart pattern to confirm a buy trade. Trying to chase sell orders after the fact is not advised here as you can be left holding the bag unless you are trying to scalp the market, of course.

I've been a professional trader for over 5 years.
Currently I work as forex analyst for different investment companies.
- EURUSDWeekly outlook – 7th January 2022 - January 7, 2022
- BTCUSD – Weekly outlook for Bitcoin Price – 23rd December 2021 - December 24, 2021
- USDSGDWeekly outlook for Singapore Dollar – 17th Dec 2021 - December 17, 2021