
ETH/USD weekly outlook for Ethereum price
Contents
After hitting a bottom of 360$, Ethereum price is in a correction mode and moving towards its first resistance level. Current market price is around 703-704$ and a pair may find a minor resistance zone at 715-716$ level. It is expecting the price could give a small correction from current market price towards its rising support which is 670-80$ minimum and 500 level of extension. We are sharing 3 different Ethereum price analysis chart to give our view about next possible movement.
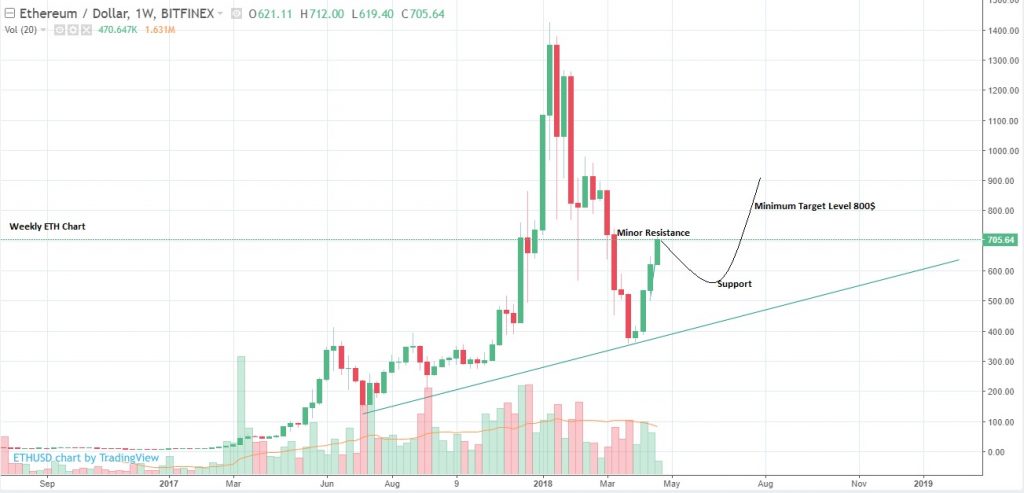
The ETH is in a bullish move in a weekly time frame chart and price is at the weekly small resistance level. If we get the weekly closing below 715$, this will be the earliest signal for the small correction towards 500 to 550$ before a new peak. The next minimum expecting target after this correction could be around 800$ as per the weekly price movement. We suggest waiting for the best price to jump in the trade.
Please have a look at the weekly technical chart below to get the logical idea about next movement.
Weekly ETH Price Chart
Daily Ethereum Price Technical Analysis
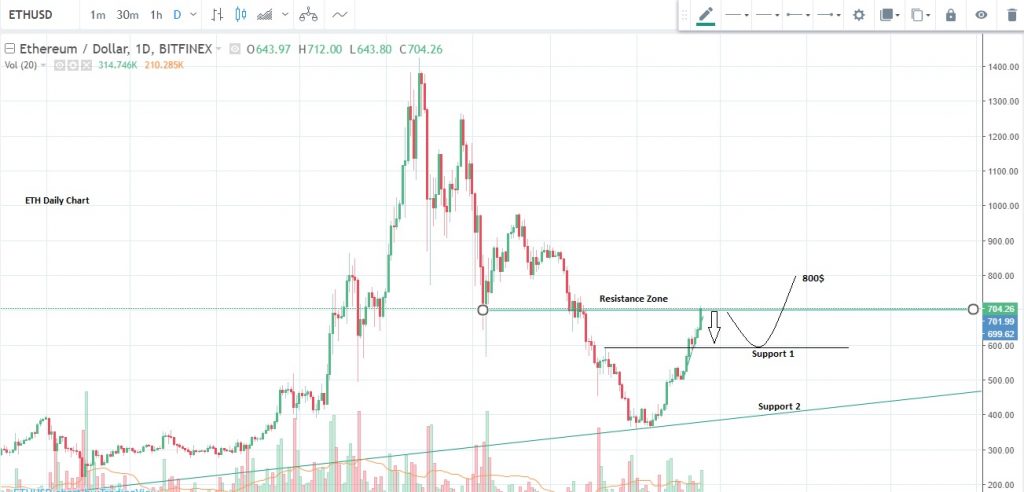
It is better to have different market views to predict the market possible movement. Daily technical chart indicating the same view as per weekly analysis, but it is also giving us a clear picture.
The price is exactly at its resistance level and it could move down towards minor support 1 mentioned in the chart below. We will look for the better price to jump in the next bullish rally.
Please have a look at ETH price chart in a daily time frame below.
Hourly Ethereum Price Technical Analysis
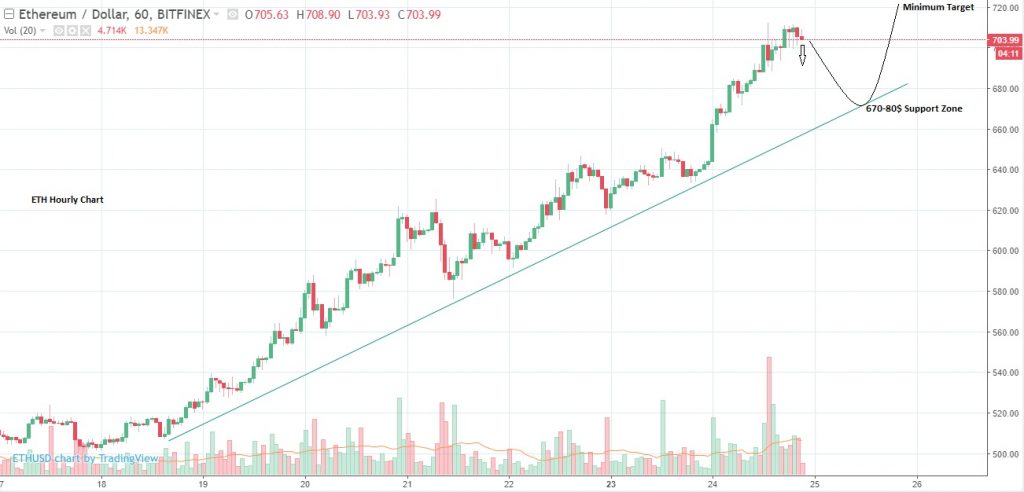
Price is moving in rising channel and making higher high and Higher low, which is the true definition of the Bullish Trend. The current ETH price is at its resistance level and a couple of reversal candle in an hourly time frame chart is indicating a correction towards the rising support level to complete its higher low pattern.
The next minimum support is forming around 660$-670$ and price could bounce from this area towards new higher high above 760$
However, if price break its rising support line drawn in a green line at the chart below, then it could hit the 500$ again
Please have a look at the hourly chart below, we have mentioned possible next movement diagram.
Hourly ETH Price Chart
Never risk more then 5% of your total capital in a single trade and always trade with the risk management plan.
Our Recommended Broker for Ethereum price : IQ Option
Best Regulated Broker: IQ Option

IQ Option is the world’s leading EU regulated financial broker based with a revolutionary platform for all traders. Very popular for crypto trading. Read IQOption review
- Best Trading App for Binary Options
- Minimum Deposit of only $10
- Minimum Trade of $1
- Trusted Broker
- $10,000 Virtual Funds ( Demo Account )
- Quick Withdrawals
- Outstanding Platform
- Weekly Tournaments
- Gain up to 98%*
DISCLAIMER

I've been a professional trader for over 5 years.
Currently I work as forex analyst for different investment companies.
- EURUSDWeekly outlook – 7th January 2022 - January 7, 2022
- BTCUSD – Weekly outlook for Bitcoin Price – 23rd December 2021 - December 24, 2021
- USDSGDWeekly outlook for Singapore Dollar – 17th Dec 2021 - December 17, 2021