
ETHUSD Weekly Review; The retracement is already past the 50% retracement level.
Contents
- The ETHUSD has been on a downward retracement for the last one week starting from 5th.
- In the last four days the market has had market price consolidation.
- There was formation of a hammer candlestick on 9th.
- The general trend across Ethereum brokers is a bearish trend.
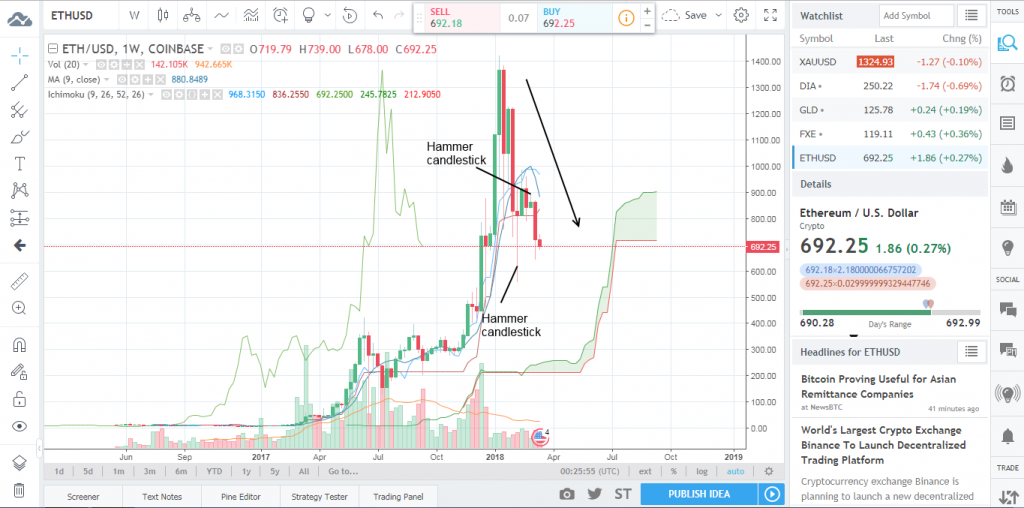
After a slight rise in price from 6th to 17th of February, the market price of ETHUSD has registered a continuous downtrend back to the support level at 691. However, the formation of a hammer at the support level, indicates a probable change of trend to a short term upward trend.
Daily Chart

Applying the Ichimoku cloud indicator and the moving average, they show that the current trend on the daily chart is a bearish trend. The red band line of the Ichimoku cloud is way above the green band line, and the market price has fallen well below the moving average line.
But as a result of the formation of the hammer candlestick on the daily chart, the price is expected to rise slightly before a breakout happens after the current market consolidation.
For the day traders, they should wait for the market to get out of the consolidation, first before placing any order at the moment. This is especially due to the formation of the hammer candlestick at the support level, which indicates very high chances of an upward retracement for a few days.
The day traders will therefore have to wait a bit longer to buy Ethereum. It is always advisable to place any order some two to three candlesticks after the anticipated price action takes place. For a buy, traders should place their take profit at 720 level, since it is a short term trade and the daily range will get to that.
Weekly chart
To confirm the weekly trend, lets look at the weekly chart
The price is way above the Ichimoku cloud with the blue band line being above the red band line. However, the price has fallen below the moving average after the consistent downward trend over the last nine weeks even though there have been slight upward retracements along the way.
There had been a very promising hammer candlestick formation from 5th to 11th and the trend retraced up a little before being countered by a bullish hammer candlestick, pushing the prices down further.
Although the price is way above the Ichimoku cloud, the current trend is expected to continue till the prices get below the Ichimoku cloud.
It is just in the early stages of the bearish trend and the price is strong. If a trader places a long term sell at the moment, by the time the Ichimoku bands will be crossing or even the prices getting below the cloud, the trader will have made quite a good profit..
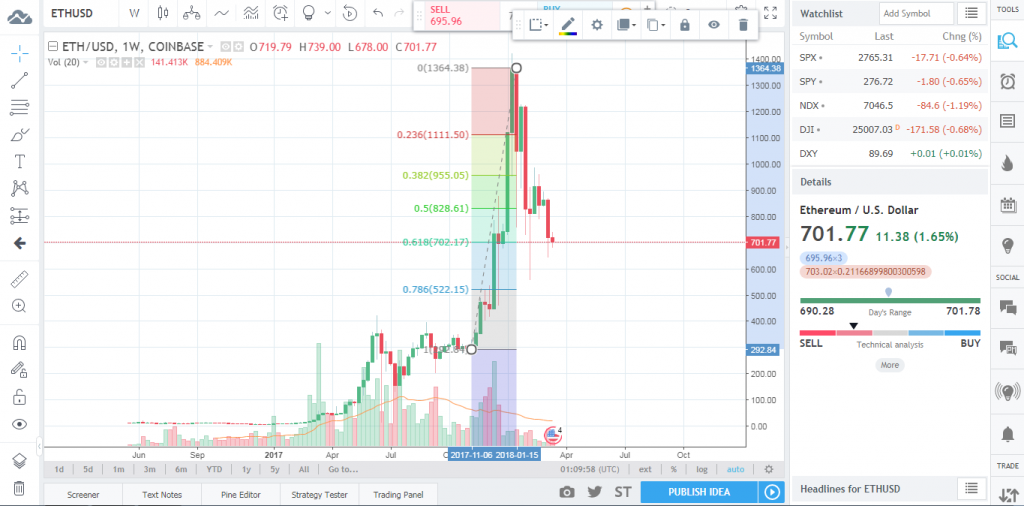
Looking at the Fibonacci retracement levels, the market prices have retraced down to 61.8% of the previous upward movement of prices as from 6/11/2017 to 8/1/2018. The retracement is already past the 50% retracement level and long term weekly traders should place their sell orders targeting the 78.6% level at 521.54.
Our Recommended Bitcoin Broker : IQ Option
Best Regulated Broker: IQ Option

IQ Option is the world’s leading EU regulated financial broker based with a revolutionary platform for all traders. Very popular for crypto trading. Read IQOption review
- Best Trading App for Binary Options
- Minimum Deposit of only $10
- Minimum Trade of $1
- Trusted Broker
- $10,000 Virtual Funds ( Demo Account )
- Quick Withdrawals
- Outstanding Platform
- Weekly Tournaments
- Gain up to 98%*
DISCLAIMER

I've been a professional trader for over 5 years.
Currently I work as forex analyst for different investment companies.
- EURUSDWeekly outlook – 7th January 2022 - January 7, 2022
- BTCUSD – Weekly outlook for Bitcoin Price – 23rd December 2021 - December 24, 2021
- USDSGDWeekly outlook for Singapore Dollar – 17th Dec 2021 - December 17, 2021