
EUR/SGD Weekly Outlook for Singapore Brokers
Contents
Introduction
Singapore, the Asian Tiger is having a nice bullish run, traded against the Euro. In the early part of the year on the 29th of January, the pair established a strong resistance level around 1.64502. This signals an end to the bullish battery of the Euro since 2017-04-23 and a positive impact of the Sing-dollars’ macroeconomic indicators, or could it be a weakening of the Euro fundamentals.
Let’s first take a quick look at the fundamentals that are exogenous to the Singapore dollar, in this case, the Eurozone economy.
Inflation Rate in the European Union and Euro Area from 2012-2022*
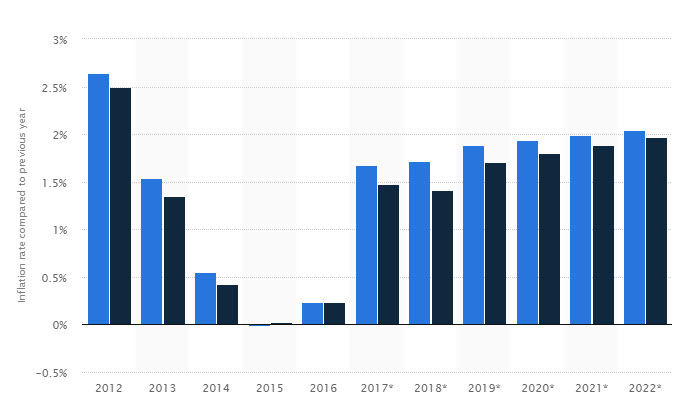
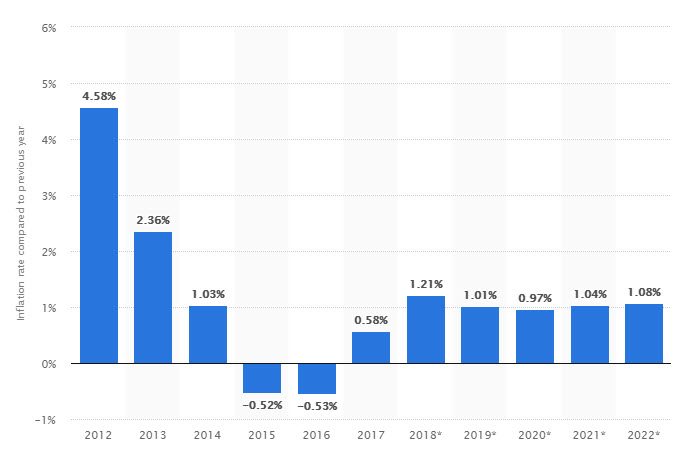
The above histogram chart illustrates a declining inflation in the European Union from the year 2012 through to 2015. A rise in inflation began in 2016 which is projected to continue into 2022. Compared to the inflation rate in Singapore shown below, we can clearly see that the Tiger experienced a decline in the inflation rate from 2012 through to 2016 and resuming a rise in 2017. This is projected to plateau moving forward into 2022.
Taking trade positions off of these fundamentals alone is quite suicidal, as we’ve not done the necessary housekeeping, which is the technical analysis.
Singapore Inflation Rate 2012 to 2022*
Technical Analysis
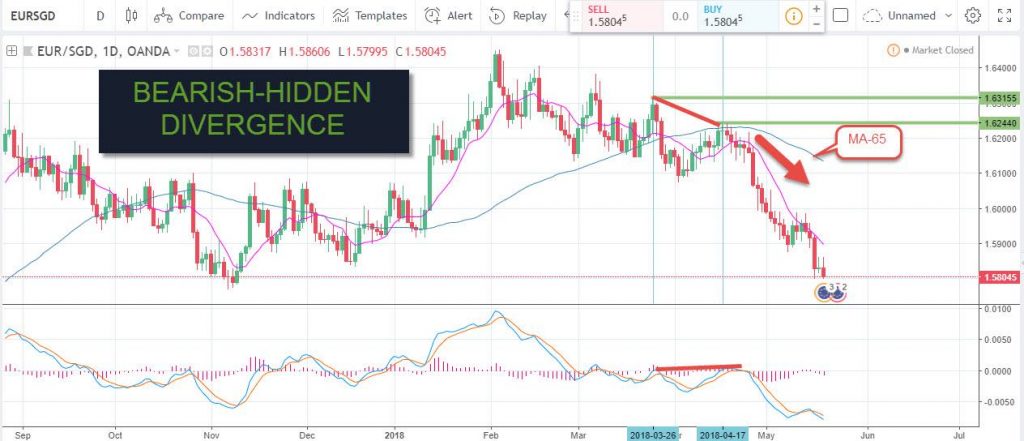
EUR vs. SGD: Weekly Chart

Zooming out to the weekly chart, a bearish regular divergence clearly confirms our fundamental sand on the Euro being overbought as a result of increasing inflation. This is signalled by a bearish regular divergence shown in below. The pair EURSGD made higher high of a price on 29-01-18 compared to a lower high of the MACD (9, 21, and 5) on the same date. A dead cross of the MACD oscillator on 05-03-18 confirmed the divergence pattern, with price currently trading on the 65-period Moving Average. An example of Singapore broker is IG Markets Singapore (IG Asia Pte Ltd).
EUR vs. SGD: Daily Chart
Moving forward into the month of April, another bearish divergence pattern was established. This time it was formed on the daily time-frame, with price resistance at 1.63155 and 1.62440 respectively, causing the price to trade further below the 65-period moving average of the same time-frame.
EUR vs. SGD: 4-Hour Chart
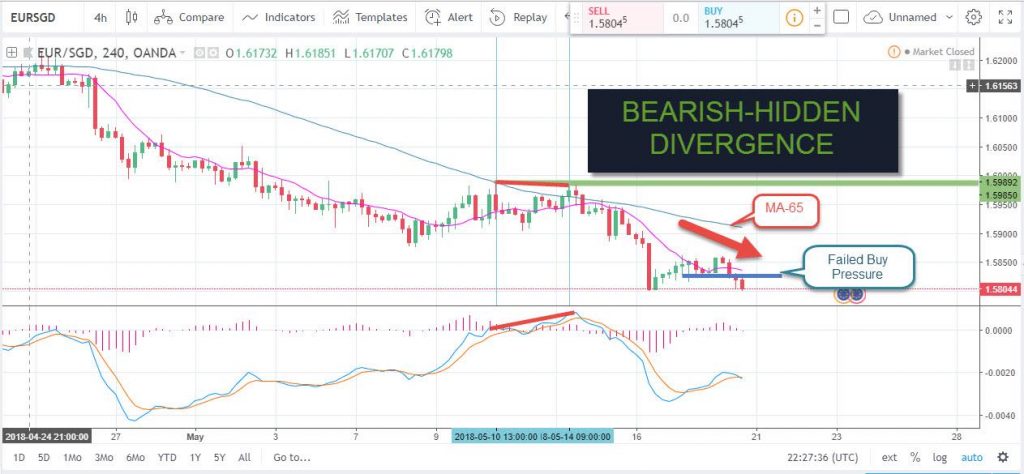
For a closer view, we decide to zoom into the 4-hour chart which gives a clearer weekly perspective. Monday 14th of May triggered a hidden bearish divergence pattern with resistance levels at 1.59892 and 1.59850 respectively. These price resistance levels were established along the 65-period moving average zone, and the price continues to trade under the MA-65. A lot of Singapore brokers offer the EURSGD pair for retail traders to carry out analysis as well as make profits on their platforms.
Conclusion
Moving forward into the new week, we’ll have to consider a fact that the pair is quite overextended for longer-term positional trading. So we’ll suggest short-term sell trades owing to the fact that the buy pressure support on the 4hour chart has just been violated.
So are you resident in Singapore and will like to take advantage of trading this pair but have no idea of which Singapore brokers will best serve you? .
Our Recommended Singapore Brokers to trade EUR/SGD : IQ Option
Best Regulated Broker: IQ Option

IQ Option is the world’s leading EU regulated financial broker based with a revolutionary platform for all traders. Very popular for crypto trading. Read IQ Option review
- Best Trading App for Binary Options
- Minimum Deposit of only $10
- Minimum Trade of $1
- Trusted Broker
- $10,000 Virtual Funds ( Demo Account )
- Quick Withdrawals
- Outstanding Platform
- Weekly Tournaments
- Gain up to 98%*
DISCLAIMER

I've been a professional trader for over 5 years.
Currently I work as forex analyst for different investment companies.
- EURUSDWeekly outlook – 7th January 2022 - January 7, 2022
- BTCUSD – Weekly outlook for Bitcoin Price – 23rd December 2021 - December 24, 2021
- USDSGDWeekly outlook for Singapore Dollar – 17th Dec 2021 - December 17, 2021