
USD/EUR weekly outlook
Contents
- The USD/EUR is on its way to a bullish trend.
- The currency pair has been in a market consolidation for the last one month.
The USD/EUR has been on a bearish trend for the whole of 2017. Traders who had predicted the long term bearish trend really benefitted over that period of one year. The currency pair, which is one of the most traded on the online brokers’ trading platforms, moved downwards by 1,170 points. Depending on the lot size and type of trading account, this translates to lots of profits.
The only time that this pair tried to retrace upwards was during the months of October and December 2017. For the whole of the rest of the year, the pair dropped continuously.
But beginning this year, the pair entered into a market consolidation where there is no general trend. The market only ranges about one place.
Weekly chart

The weekly chart is the one that is giving a clearer picture of the market consolidation. If you look at the last three months, the market has been consolidating about one point. When a market is in consolidation, traders should avoid placing orders since it is very hard to predict the next move for the pair.
However, there is light at the end of the tunnel since the consolidation is converging upwards, indicating a very high probability of breaking out upwards.
Also, the cross MA has almost and the price is slightly above the two MA lines. This also indicates a bullish trend.
If the current candlestick of USD/EUR closes as a bullish candlestick and the next candlestick opens as a bullish candlestick, then traders should place buy orders. But you will have to be patient and wait for the conditions to be met.
The Ichimoku Cloud indicator is still indicating a bearish trend. But that is understandable since the bullish trend is yet to confirm.
Daily chart
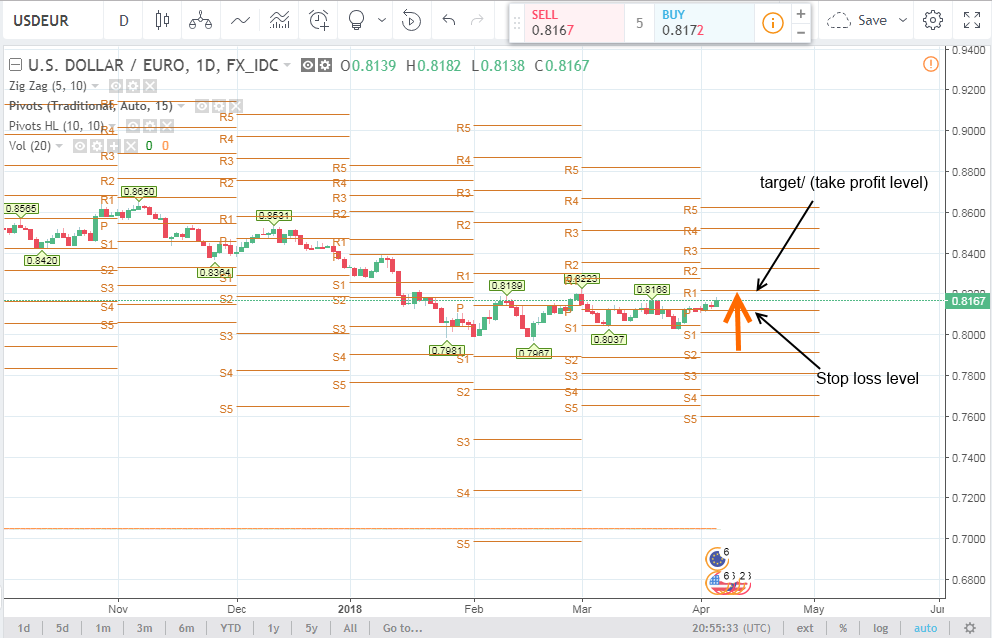
For the day traders, the best chart would be the daily chart.
From the daily chart, it is evident that the market is best traded using the swing strategy.
To help identify the market swings, you will be required to use the support and resistance levels. Looking at the market on the daily chart, you can easily notice the swings; but it will require the use of the pivot point’s indicator to identify the best entry and exit points for trades.
When the market hits a support level and doesn’t breakthrough and the subsequent formed candlestick is bullish, then a trader should place a buy with the target at the next nearest resistance. The same applies if the market hits a resistance level and doesn’t break through, but the next formed candlestick is bearish; then the trader should place a sell order with a target at the next nearest support level.
Currently, short term traders should place a buy with a take profit at the resistance level R1 at 0. 8211. This will give a 43 points. (NB: if the order was taken early, the profits would be larger).
When placing the take profit target, traders should also remember to place a stop loss. The stop loss should be placed at the nearest resistance level; which in this case is S1 at 0.8118. This would result in a loss of 50 points.
Our Recommended Online Brokers to trade : IQ Option
Best Regulated Broker: IQ Option

IQ Option is the world’s leading EU regulated financial broker based with a revolutionary platform for all traders. Very popular for crypto trading. Read IQOption review
- Best Trading App for Binary Options
- Minimum Deposit of only $10
- Minimum Trade of $1
- Trusted Broker
- $10,000 Virtual Funds ( Demo Account )
- Quick Withdrawals
- Outstanding Platform
- Weekly Tournaments
- Gain up to 98%*
DISCLAIMER

I've been a professional trader for over 5 years.
Currently I work as forex analyst for different investment companies.
- EURUSDWeekly outlook – 7th January 2022 - January 7, 2022
- BTCUSD – Weekly outlook for Bitcoin Price – 23rd December 2021 - December 24, 2021
- USDSGDWeekly outlook for Singapore Dollar – 17th Dec 2021 - December 17, 2021