
EURUSD Technical Analysis for Singapore
Contents
Introduction
The question in the online brokers’ such as IQ Option mind will be towards the bullish momentum of the EUR/USD pair. Can the Euro zones continue the bullish momentum, or should they expect a reversal of the trend?
Fundamentals
Euro Zone
Main Refinancing Rate:
The ECB is responsible for the interest rate decision as it provides the liquidity needed in the banking system operates.
The decisions are made eight times in a year, and it’s been priced into the market by the ECB Executive board.
When the actual data is greater than the forecasted information, it is suitable for the Euro, but it won’t be ideal for the currency if it is not more significant.
The U.S.
Core Consumer Price Index (CPI) MoM
These data released by the Bureau of Labor Statics show the changes in the price of services and the goods from the consumers’ point of view, and these services and goods exclude the energy and foods.
If the actual data released is higher than the forecast, it is suitable for the U.S. dollar, while a lower outcome will mean bad for the US dollar.
The forecast for CPI is 0.2% while the Previous is 0.6%.
EUR vs. USD Bigger Picture: Bullish bias
EURUSD Technical Analysis
Monthly

Monthly Resistance: 1.14950, 1.15698, 1.18523, 1.21545, 1.25558
Monthly Support: 1.06359, 1.10292, 1.08288, 1.03402
The EURUSD pair has been bullish for the past four months due to a weaker US dollar.
As the bulls were able to break and close above the resistance zone of 1.15698, it was able to push the price higher to the 1.18523.
The resistance zone of 01 June 2018 has slowed down the bulls surge because the bulls are moving towards the levels resistance from 1.21545 levels upwards.
Weekly Chart Bullish

Weekly Resistances: 1.19207, 1.14963, 1.14222
Weekly Supports: 1.16959, 1.12430, 1.11726, 1.06361
The EURUSD pair shows a weak bullish momentum to the upside after weeks of the Bull’s dominance in the financial market.
Could this move be a correction of the swing from the support zones of 1.11726 to the resistance zones of 1.19207?
In the above weekly illustration, you can see the price’s consolidation at the resistance levels, attracting the short term traders coming into the market.
We expect the new week to have a higher possibility that the Bears will push back the price to the 1.16559 low and lower to the previous resistance levels of 1.14963 and 1.1422, which is now acting as a support in the nearest future.
However, the Singapore brokers‘ needs to see the price action close below the double bullish accumulation support to confirm a bearish trend. If that action fails, we may see another bullish surge from that support zone to take out the resistance of 1.19207.
EURUSD Mid-Term Projections: Bullish
EURUSD: Daily
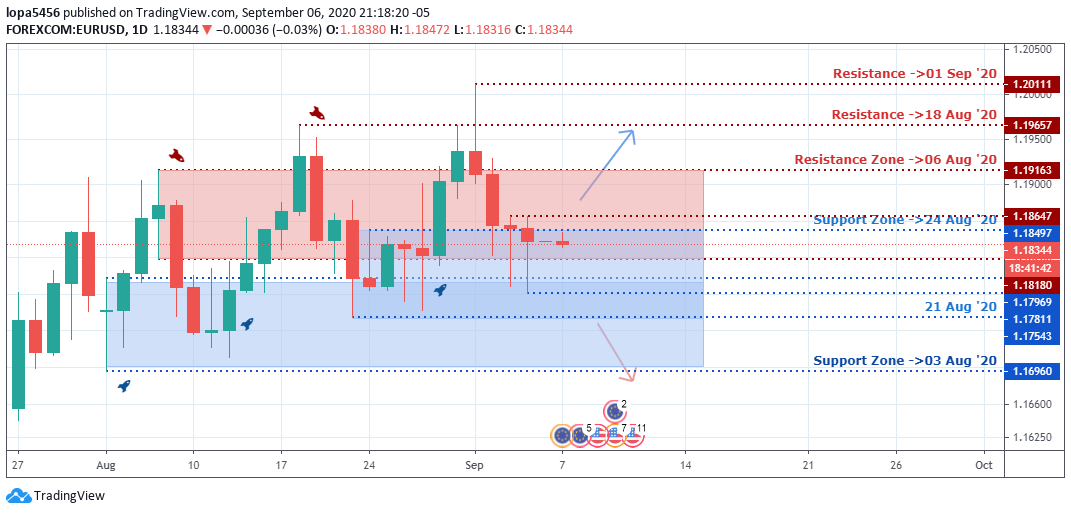
Daily Resistance: 1.17814, 1.20111, 1.19657, 1.19163, 1.18647
Daily Support: 1.11681, 1.16960, 1.17811, 1.18497
The Daily chart time frame has shown us the rejection of price at the resistance levels three times from the zones. These signals a sign of the bears accumulating contracts for a short position.
As you can see, the EURUSD pair is in a range between the 1.19163 and 1.17969 that kept the pair trapped. A breakout to either side will give us a directional bias for the pair.
If the bulls’ pressure can close above the resistance of 1.19657, we can see a continuation of an uptrend, while the bears need the price to close below the 1.17969 levels for the bearish trend effects. A close below is a reversal of the trend from the uptrend to the down direction, confirming the double top or triple top pattern.
EURUSD: H4
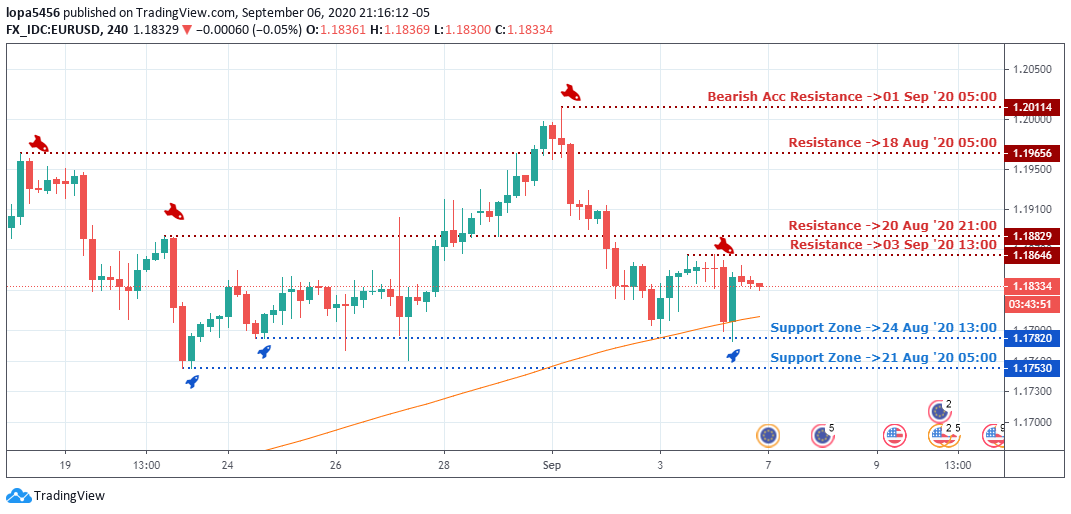
H4 Resistance: 1.17814, 1.20114, 1.19656, 1.18829, 1.18646
H4 Support: 1.15796, 1.17530, 1.17820
The bullish swing from the support levels of 1.17820 failed to go above the bearish accumulation of resistance 1.20114 before the bears pushed back the price due to the healthy U.S. economy calendar, making the U.S. dollar strong.
At the time of this report, we can see a double bottom price action pattern forming, which may take the price up back to the resistance level of 1.19656 should the resistance zone of 1.18646 give ways to the bulls surge.
However, should the resistance zone of 1.188529, 1.18464, resist the price, we may see the bears push the pair to the lows of 1.17220 and 1.17530 to close below that level for a continuation of the bearish trend.
Bearish Scenario:
From the four-hour time frame and weekly chart, we can see that there are possible movements of the downtrend to take place as we see a strong U.S. dollar come to play at the resistance levels of 1.19207.
Bullish Scenario:
The bullish candles show a weak momentum as they get smaller on the weekly time frame.
A bullish close above the resistance zones of the 1.18464 and 1.188529 on the four-hour time frame may confirm another bullish swing, and a close above the 1.19207 resistance zone will bring in the long position traders take over the EURUSD.
Conclusion and Weekly Price Objectives
The dollar will likely be strong this trading week as the key resistance levels push back the bullish trend that has been dominant for weeks.
We advise the online brokers to get a confirmed bearish trend signal on the four-hour time frame for a fair trade that will last for the week. However, a bullish surge on H4 can take the price to the resistance level of 1.20114.

I've been a professional trader for over 5 years.
Currently I work as forex analyst for different investment companies.
- EURUSDWeekly outlook – 7th January 2022 - January 7, 2022
- BTCUSD – Weekly outlook for Bitcoin Price – 23rd December 2021 - December 24, 2021
- USDSGDWeekly outlook for Singapore Dollar – 17th Dec 2021 - December 17, 2021
Tagged with: EUR/USD