
EURUSD Technical Analysis for Singapore
Contents
Introduction
The state of the EUR/USD pair is a concern for brokers such as Olymp Trade as we see the pair in the trend’s resting stage. A pullback may mean recovery of the dollar, which may be a reversal of direction, or we see a breakout in the coming weeks.
Fundamentals
Euro Zone
French Flash Services PMI
In the Euro zones, the survey is carried out by Managers over seven hundred purchasing managers to rate their activities’ outcome performance across the various sectors and how it affects the prices of goods and services, employment, and production.
A good result for the Euro must be above the forecast, but a result below the forecast won’t favor the currency.
The forecast data is 52.2, while the previous data was 51.5.
U.S.
Flash Manufacturing PMI
The diffusion index of the purchasing managers is measured in the manufacturing industry, having collected data from over 750 purchasing managers to access various factors that influence the businesses in terms of employment, prices, production, among other factors.
A reading above the 50.0 level is seen as an expansion in the industries, which will boost U.S. currencies (dollar). Still, a reading below the forecast will mean depreciation in the U.S. dollar.
The forecast data is 52.5 while the previous data was 53.1
EURUSD Technical Analysis
EUR vs. USD Bigger Picture: Bullish bias
Monthly Chart

Monthly Resistance: 1.15698, 1.21545, 1.25558, 1.18523,
Monthly Support: 1.10292, 1.08288, 1.06359, 1.03402, 1.18600, 1.15698
How soon can the US dollar recover from its loss as the EURUSD pair finds a resistance within the previous zones of resistances, or is there any possible breakout above the resistances?
The above questions are possible thoughts running through the minds of the online brokers and traders worldwide.
The bullish momentum buildup started amid the COVID-19 pandemic that caused uncertainty in the fiat market and total lockdown in the world economy. We can see the effects of the stimulus plan that helps the global economy recover gradually after the pandemic’s impact.
A bullish trend is still at play on the monthly chart, and a close above the 1.25558 will mean a continuation of the movement while a close below the support zone of 1.18600 will expose the 1.15698 levels.
EURUSD: Weekly Chart Bullish
Weekly Chart

Weekly Resistances: 1.20114, 1.19207, 1.14963, 1.14222,
Weekly Supports: 1.07197, 1.06361, 1.07666, 1.16959, 1.12430, 1.11726, 1.08968,
The weekly timeframe has been less active for weeks since the bullish trend has been slowed down. Should we expect a momentum gain for the US dollar, or is the trend resting before another upward surge?
The resistance zones of 1.19207 and 1.20114 have been rejecting the Bulls advancement for weeks because it’s a psychological level for the EUR/USD pair.
If the bulls can close above the zone, we shall have the trend continue, but if the Bears are more robust and they reject the move to close below 1.16959, this will push down the price to 1.14222.
Daily Time Frame
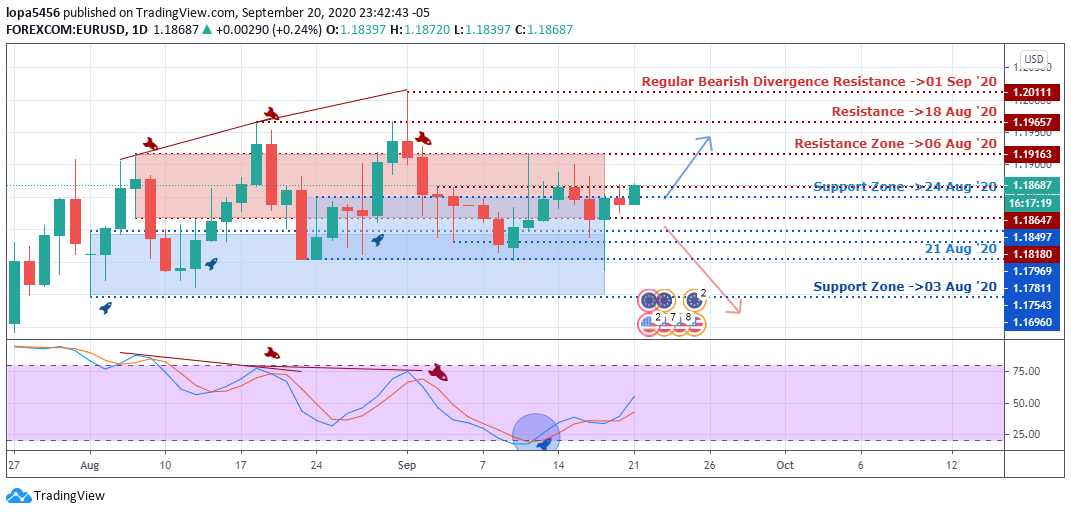
Daily Resistance: 1.19657, 1.20111, 1.19163
Daily Support: 1.17811, 1.17543, 1.17969
When writing this report, we can see the days’ candle heading towards the resistance zone of 1.19163 for a retest and a possible breakout if the bulls can break through all levels of resistance before they can have total control.
However, the bears are looking to take control, having rejected the advancement with the hope of closing below the 1.17969 support.
4Hour Time Frame
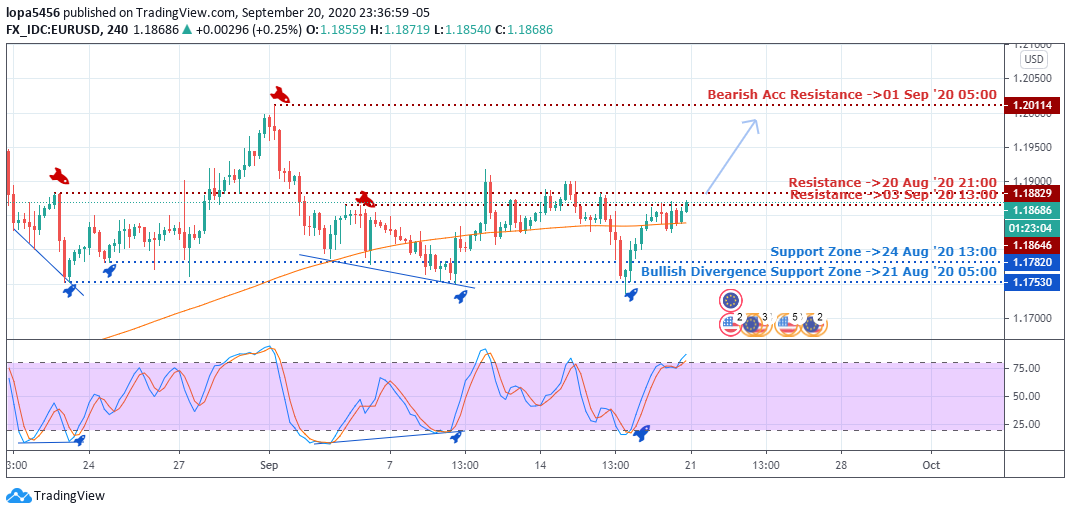
H4 Resistance: 1.18646, 1.18829, 1.20114
H4 Support: 1.17820, 1.17530
You can see the recent double bottom formed on the four-hour timeframe in line with other multiple tests of the zones (1.17820, 1.17530) showing the bull’s position on that timeframe.
The present position of the price at the time of this report is a test for the bulls; if they can close above the resistance will expose the next resistance zone of 1.20114.
The Bears have two positions to protect if they must contend for control over the four hour’s timeframe, the 1.18829 and 1.20114 zones for rejection of the bull’s advancements. We may see the bears reacting at those levels over time.
Bearish Scenario:
The Bears position is under threat on the four hours timeframe; they need to push back the Bulls from the critical resistance levels (1.18829, 1.20114) if they must have control of the market.
Bullish Scenario:
The bullish scenario has been tending on the higher time frames for an extended time before entering the resting state. For seven weeks, the EURUSD pair has not been able to close above the resistance zones of 1.20114. The Bulls need to overcome the psychological level for an uptrend continuation.
Conclusion and Weekly Price Objectives
If the US dollar can recover from the point where the market is, we may begin to see the EURUSD pair drop lower, and a bearish trend may start at the close of the 1.16959 levels.
However, another test of the weekly high by the bulls in the running week and a successful push may become trend continuation should they close above.

I've been a professional trader for over 5 years.
Currently I work as forex analyst for different investment companies.
- EURUSDWeekly outlook – 7th January 2022 - January 7, 2022
- BTCUSD – Weekly outlook for Bitcoin Price – 23rd December 2021 - December 24, 2021
- USDSGDWeekly outlook for Singapore Dollar – 17th Dec 2021 - December 17, 2021
Tagged with: EUR/USD