
SGD/USD weekly review
Contents
- The SGD/USD is generally on an upward trend.
- Has very great swings for swing trading.
- Place a buy at the current price with your target at 0.7633.
SGD/USD currency pair, which is one of the most valued pair of the Singapore brokers has maintained its upward trend since January last year. However, over the last four weeks, it has been correcting a previous retracement and it has already retraced back by 78.6%.
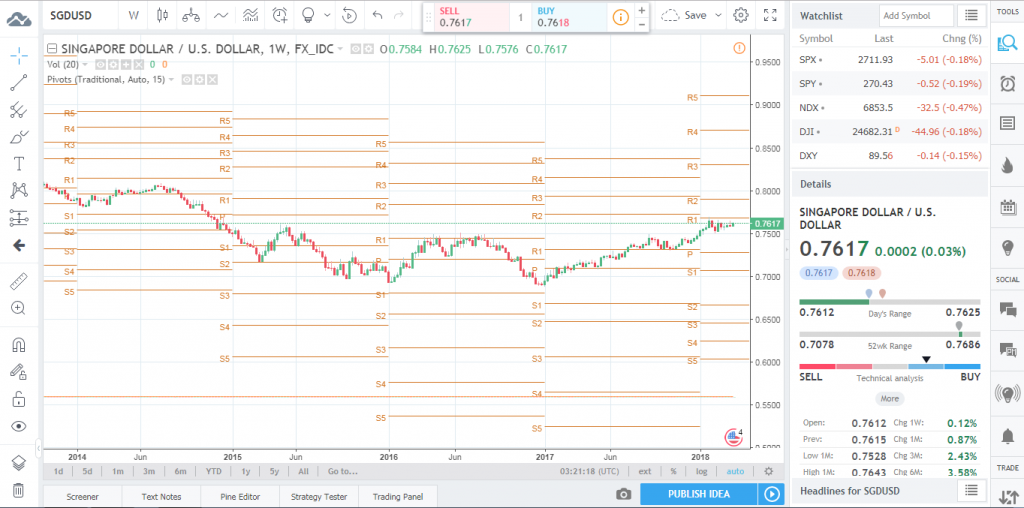
Weekly chart

By applying the Ichinoku Cloud indicator on the weekly chart, it shows that the current trend of the SGD/USD is bullish. The bullish trend is quite strong, considering that the prices are high above the Ichinoku green cloud. Also, the green Ichinoku band line is above the red band line and the band is also on an upward trend.
This can be confirmed by using the Moving average. The price is slightly above the moving average.
Looking closely at the market, you shall realise that there has been two hammer formations: one four weeks ago and the other one a week ago.
The first hammer candlestick successfully indicated the start of the correction of the downward retracement since it was followed by bullish candlsicks. But the second hammer candlestick was overpowered by the momentum of the upward trend. This week has actually proven the market wrong by assuming a bullish trend against the hammer candlestick.
Daily chart
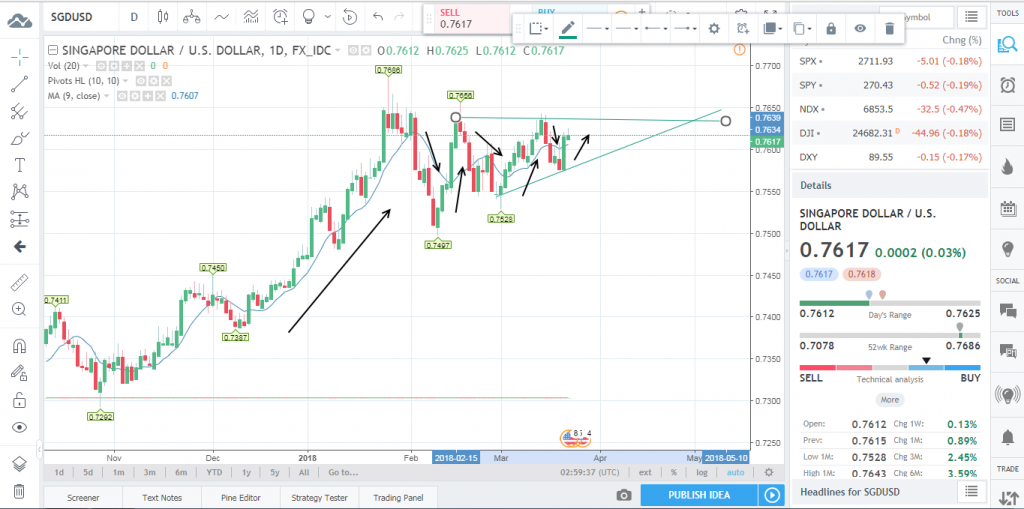
For the short term daily traders, SGD/USD is one of the best currency pairs to trade. The currency pair has a very volatile market and there are quite a lot of market swings that the traders can take advantage of.
The SGD/USD has been on a very strong bullish trend. Nevertheless, it has been displaying very healthy market swings which are better viewed on lower timeframes likes the daily and below.
Using the daily chart, you will realise that the market has been going through a convergence forming an ascending triangle pattern.
The market swings during the convergence started with quite large swings which have since reduced while inclining upwards.
Taking the average daily range, which is 10, the price will have broken through the ascending triangle since the difference between the upper line and the current market price is only 16 points. This means that it will roughly take two days at most, for the prices to go through. This shows that it is just a matter of time before the currency pair resumes its bullish trend.
Targets for Long term traders
For the long term traders, a buy order would be advisable at the current price.
To get the target (take profit level), we will use the standard Pivot Point indicator to identify the various resistance and support levels on the weekly chart to at least give a projection of what to expect for the rest of the week.
With a long term buy order at the current price, it will be advisable to place a take profit at the First resistance level which is at 0.7681. This will guarantee the trader a cool 60 points by the end of the week.
Our Recommended Singapore Brokers to trade : IQ Option
Best Regulated Broker: IQ Option

IQ Option is the world’s leading EU regulated financial broker based with a revolutionary platform for all traders. Very popular for crypto trading. Read IQ Option review
- Best Trading App for Binary Options
- Minimum Deposit of only $10
- Minimum Trade of $1
- Trusted Broker
- $10,000 Virtual Funds ( Demo Account )
- Quick Withdrawals
- Outstanding Platform
- Weekly Tournaments
- Gain up to 98%*
DISCLAIMER

I've been a professional trader for over 5 years.
Currently I work as forex analyst for different investment companies.
- EURUSDWeekly outlook – 7th January 2022 - January 7, 2022
- BTCUSD – Weekly outlook for Bitcoin Price – 23rd December 2021 - December 24, 2021
- USDSGDWeekly outlook for Singapore Dollar – 17th Dec 2021 - December 17, 2021
Tagged with: sgdusd